
Understanding Base Reflectivity Maps: A Quick Guide
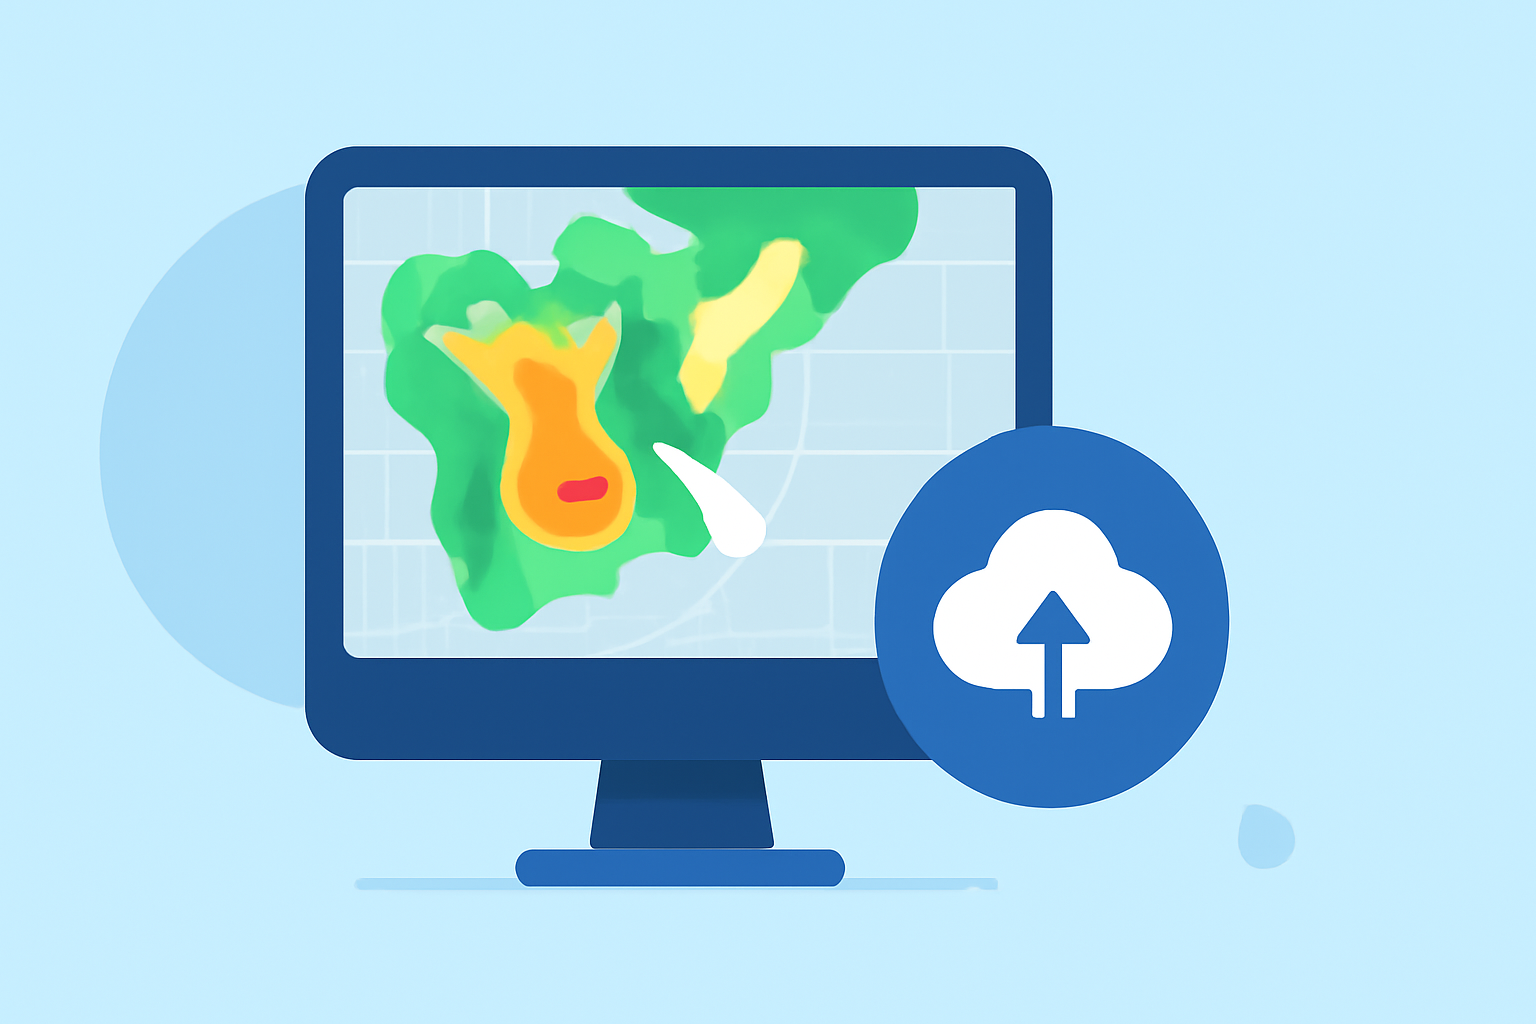
Base reflectivity maps are essential tools in meteorology, providing real-time insights into precipitation patterns and storm structures. These maps display the intensity of precipitation by measuring the reflectivity of raindrops, snowflakes, and other hydrometeors as detected by Doppler radar systems.
What Are Base Reflectivity Maps?
Base reflectivity maps illustrate the strength of precipitation echoes received by radar, measured in decibels relative to Z (dBZ). Higher dBZ values indicate more intense precipitation. For instance, a dBZ of 65 corresponds to a rainfall rate exceeding 16 inches per hour, while a dBZ of 50 equates to approximately 1.9 inches per hour. (prod-01-alb-www-noaa.woc.noaa.gov)
How Are They Created?
These maps are generated by the National Weather Service (NWS) using data from a network of Doppler radars. The NWS produces base reflectivity images from the network of Doppler radars. Every 5 minutes, a national radar mosaic of base reflectivity is generated with the latest information. (ncei.noaa.gov)
Why Are They Important?
Base reflectivity maps are crucial for:
- Precipitation Detection: Identifying areas of rainfall, snow, or hail.
- Storm Analysis: Assessing storm intensity and potential for severe weather.
- Forecasting: Providing data for short-term weather predictions.
How Does Clime Enhance the Use of Base Reflectivity Maps?
Clime offers advanced tools that integrate base reflectivity data, providing users with:
- Real-Time Updates: Access to the latest precipitation data for timely decision-making.
- Interactive Visualizations: User-friendly interfaces that display complex data intuitively.
- Comprehensive Forecasts: Enhanced weather predictions by combining base reflectivity with other meteorological data.
Conclusion
Base reflectivity maps are fundamental in understanding and forecasting weather patterns. By leveraging Clime's advanced tools, users can gain deeper insights into precipitation dynamics, leading to more accurate and timely weather information.
Highlights:
- Next Generation Weather Radar (NEXRAD) | National Centers for Environmental Information (NCEI)
- Terminal Doppler Weather Radar (TDWR) | National Centers for Environmental Information (NCEI)