
Understanding Composite Reflectivity Maps: A Comprehensive Guide
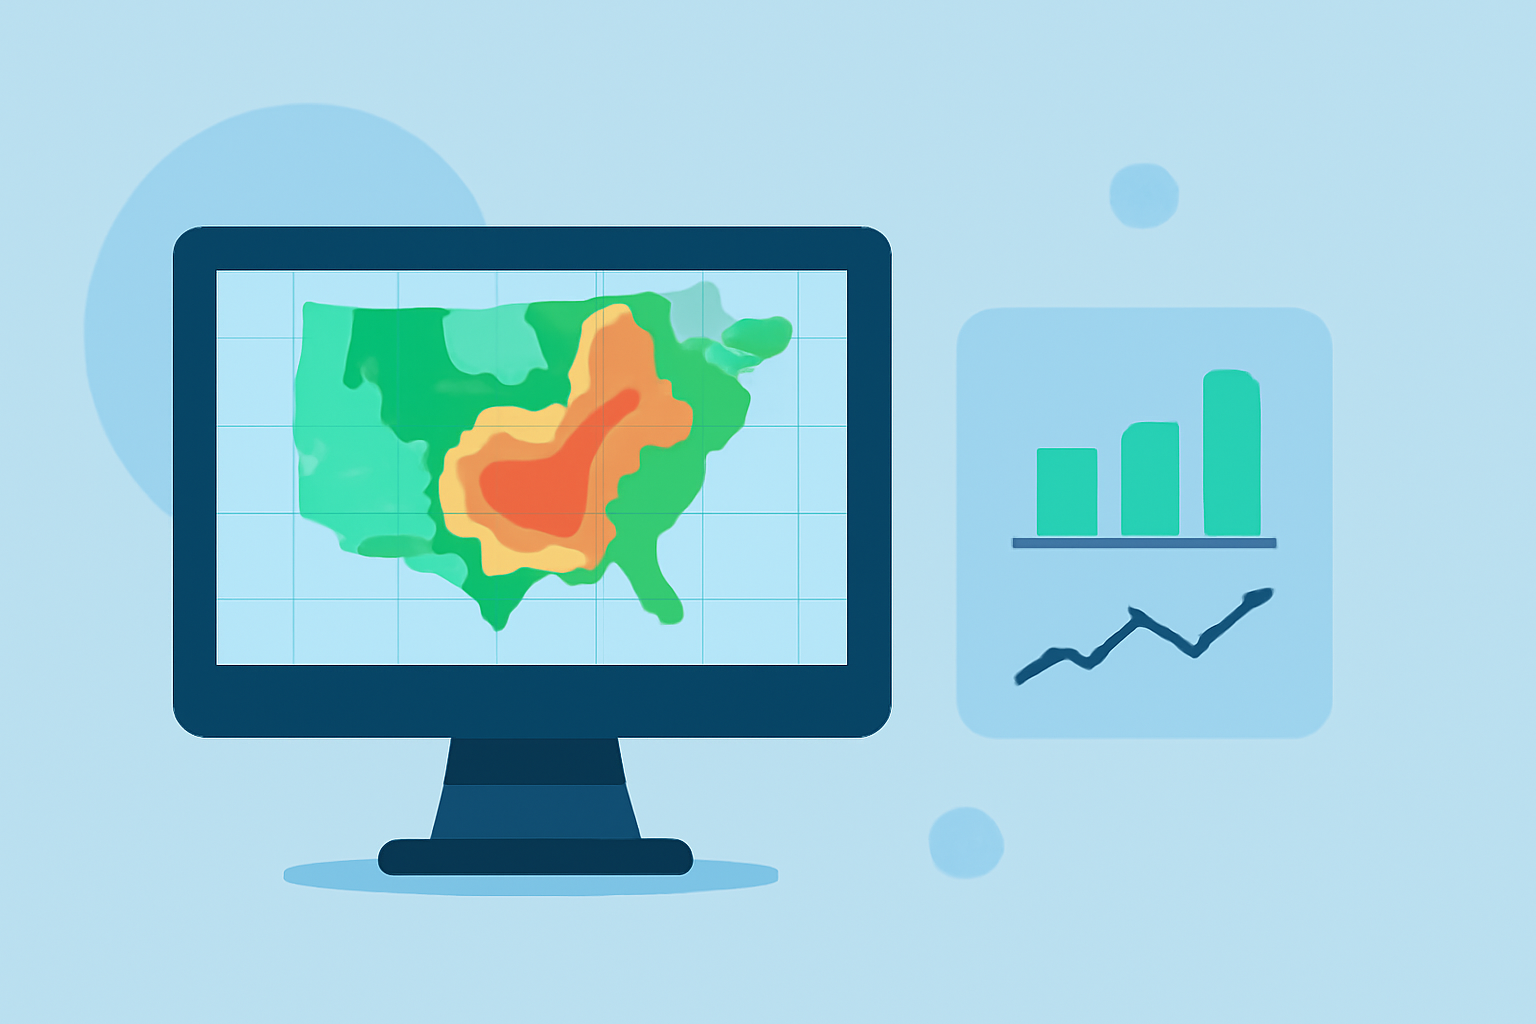
Composite reflectivity maps are essential tools in meteorology, providing a comprehensive view of precipitation intensity and storm structure. These maps display the maximum reflectivity values from various radar elevation angles, offering insights into the vertical profile of storms. Understanding and effectively utilizing these maps is crucial for accurate weather forecasting and analysis.
What Are Composite Reflectivity Maps?
Composite reflectivity maps are generated by combining data from multiple radar elevation scans to present the highest reflectivity values observed in a vertical column above each point on the map. This approach allows meteorologists to assess the most intense precipitation areas within a storm system, regardless of the storm's altitude. By integrating information from different radar angles, composite reflectivity maps provide a more comprehensive understanding of storm dynamics compared to single-elevation scans.
How Are Composite Reflectivity Maps Created?
The creation of composite reflectivity maps involves several key steps:
-
Radar Data Collection: Weather radars perform volume scans at multiple elevation angles, capturing reflectivity data at each angle.
-
Data Integration: The reflectivity values from all elevation angles are combined to identify the maximum reflectivity at each horizontal grid point.
-
Map Generation: The integrated data is then used to create a visual representation, highlighting areas of intense precipitation.
This process ensures that the composite reflectivity map accurately reflects the strongest precipitation signals within a storm system.
Applications of Composite Reflectivity Maps
Composite reflectivity maps are utilized in various meteorological applications:
-
Severe Weather Detection: They help identify areas of intense precipitation, which can indicate severe weather phenomena such as thunderstorms, hail, or tornadoes.
-
Storm Tracking: Meteorologists use these maps to monitor storm development and movement, aiding in the prediction of storm paths and potential impacts.
-
Aviation Safety: Air traffic controllers and pilots rely on composite reflectivity maps to avoid areas of heavy precipitation and turbulence, ensuring flight safety.
Limitations of Composite Reflectivity Maps
While composite reflectivity maps are valuable, they have certain limitations:
-
Vertical Resolution: They may not provide detailed information about precipitation at specific altitudes, potentially missing lower-level storm features.
-
Bright Band Contamination: The melting of snowflakes can create a bright band in the radar data, leading to overestimation of precipitation intensity near the ground.
Enhancing Accessibility and Interpretation with Clime
Clime offers advanced tools that enhance the accessibility and interpretation of composite reflectivity maps:
-
User-Friendly Interface: Clime's platform provides an intuitive interface, allowing users to easily access and interpret composite reflectivity data.
-
Real-Time Data: Clime delivers up-to-date composite reflectivity maps, ensuring users have the latest information for accurate weather analysis.
-
Comprehensive Visualizations: Clime's visualizations integrate composite reflectivity with other meteorological data, offering a holistic view of weather conditions.
Conclusion
Composite reflectivity maps are indispensable in meteorology, offering critical insights into storm structures and precipitation patterns. By leveraging Clime's advanced tools, users can access and interpret these maps more effectively, enhancing weather forecasting and decision-making processes.