
Understanding Composite Reflectivity Maps: A Step-by-Step Guide
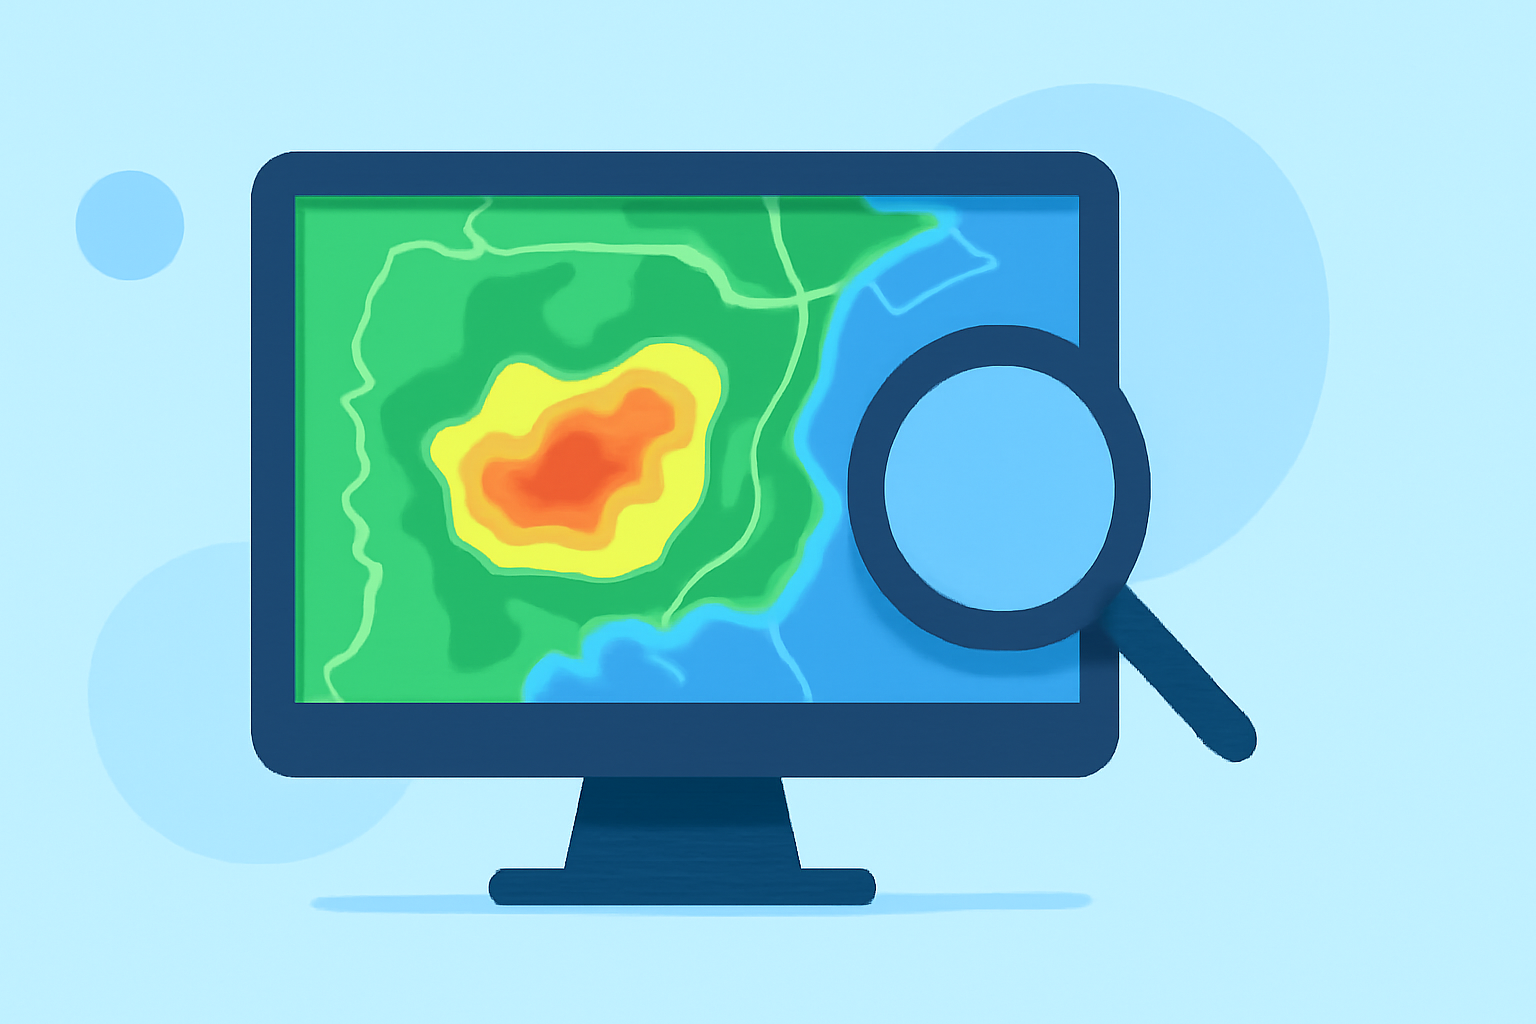
Composite reflectivity maps are essential tools in meteorology, providing a comprehensive view of precipitation intensity and storm structure. By analyzing these maps, meteorologists can make informed decisions about weather patterns and potential hazards.
What Are Composite Reflectivity Maps?
Composite reflectivity maps display the maximum reflectivity values from various radar elevation angles, capturing the strongest echoes within a vertical column of the atmosphere. This approach ensures that the most intense precipitation is highlighted, offering a clear picture of storm severity. (prod-01-alb-www-noaa.woc.noaa.gov)
How Are Composite Reflectivity Maps Created?
-
Data Collection: Weather radars emit pulses of energy that bounce off precipitation particles, returning with information about the intensity and location of the precipitation.
-
Vertical Scanning: Radars scan the atmosphere at multiple elevation angles, capturing data from different heights.
-
Data Integration: The highest reflectivity value from each vertical column is selected, creating a composite image that represents the most intense precipitation at any altitude. (prod-01-alb-www-noaa.woc.noaa.gov)
How to Interpret Composite Reflectivity Maps?
-
Color Coding: Reflectivity values are typically color-coded, with darker colors indicating higher reflectivity and, consequently, more intense precipitation.
-
Identifying Storm Features: The composite reflectivity map can reveal storm structures such as updrafts, downdrafts, and areas of heavy rainfall.
-
Assessing Storm Intensity: By examining the areas with the highest reflectivity, meteorologists can gauge the strength of a storm and predict potential severe weather events. (prod-01-alb-www-noaa.woc.noaa.gov)
Limitations of Composite Reflectivity Maps
While composite reflectivity maps are invaluable, they have certain limitations:
-
Vertical Resolution: These maps may not provide detailed information about precipitation at specific altitudes, potentially missing important storm features.
-
Bright Band Contamination: The melting of snowflakes can create a bright band in the radar data, leading to artificially high reflectivity values that may not correspond to actual precipitation at the surface. (prod-01-alb-www-noaa.woc.noaa.gov)
Applications of Composite Reflectivity Maps
-
Weather Forecasting: They assist in predicting storm development and movement, aiding in the issuance of weather warnings.
-
Aviation Safety: Pilots use these maps to navigate around severe weather, ensuring flight safety.
-
Public Safety: Emergency services rely on these maps to prepare for and respond to severe weather events effectively.
By understanding and utilizing composite reflectivity maps, meteorologists and the public can better anticipate and respond to weather phenomena, enhancing safety and preparedness.