
Understanding Composite Reflectivity Maps: A Comprehensive Guide
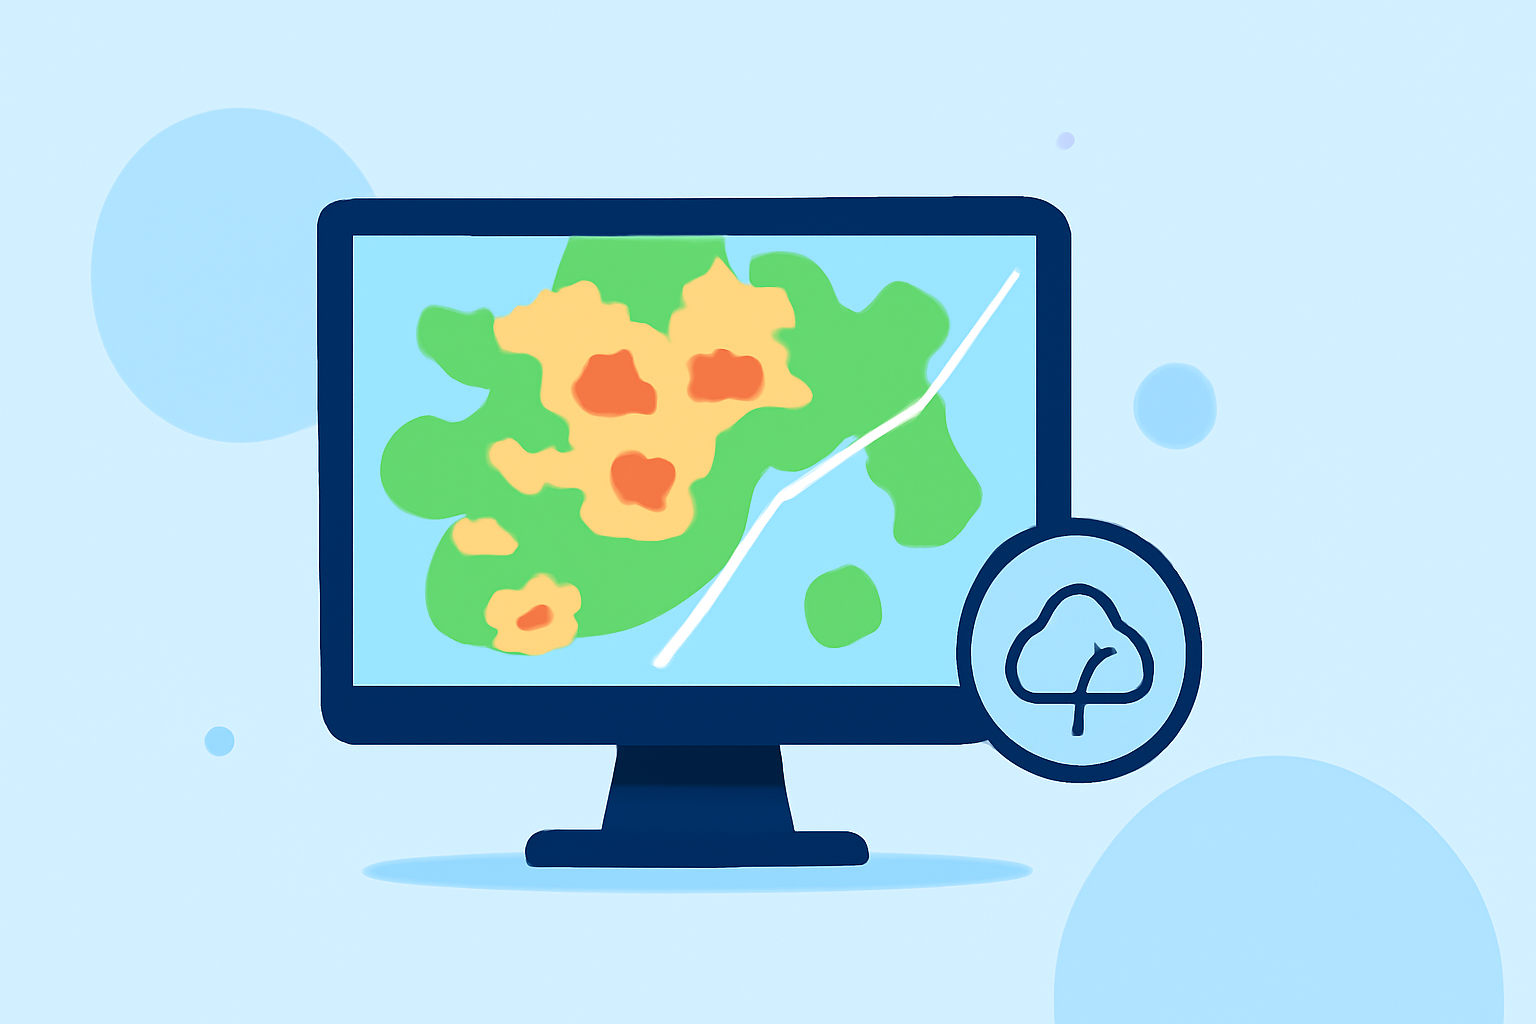
Composite reflectivity maps are essential tools in meteorology, providing a comprehensive view of precipitation intensity and structure. By integrating data from multiple radar elevation angles, these maps offer insights into storm dynamics and potential severe weather events.
What Are Composite Reflectivity Maps?
Composite reflectivity maps display the maximum reflectivity values from various radar elevation angles, creating a unified image that highlights the strongest precipitation echoes within a specific area. This approach allows meteorologists to assess the vertical structure of storms and identify features that might not be evident in single-angle scans.
How Are Composite Reflectivity Maps Created?
Weather radars emit beams at multiple elevation angles, each capturing reflectivity data at different heights above the ground. The composite reflectivity map compiles the highest reflectivity values from these scans, presenting a comprehensive picture of precipitation intensity and distribution. This method is particularly useful for detecting features like strong updrafts and potential severe weather conditions.
Key Features and Applications
-
Enhanced Storm Detection: By combining data from various elevation angles, composite reflectivity maps can reveal storm features such as overhangs and bounded weak echo regions (BWERs), which are indicative of severe weather potential.
-
Improved Precipitation Assessment: These maps help distinguish between precipitation that reaches the ground and that which evaporates or sublimates before reaching the surface, providing a clearer picture of actual rainfall or snowfall.
-
Operational Decision-Making: Meteorologists use composite reflectivity maps to make informed decisions regarding weather warnings, air traffic management, and public safety measures.
Limitations and Considerations
While composite reflectivity maps are invaluable, they have certain limitations:
-
Bright Band Contamination: The melting layer, known as the bright band, can cause anomalously high reflectivity values, potentially leading to misinterpretations of precipitation intensity.
-
Vertical Resolution Constraints: The vertical resolution of composite reflectivity maps may not capture fine-scale storm structures, necessitating the use of additional radar products for detailed analysis.
Conclusion
Composite reflectivity maps are vital tools in meteorology, offering a synthesized view of precipitation intensity and storm structure. By understanding their creation, applications, and limitations, meteorologists can enhance weather forecasting and improve public safety.
For a visual representation of composite reflectivity principles, refer to the image below:
This image illustrates how composite reflectivity integrates data from multiple radar elevation angles to provide a comprehensive view of precipitation intensity.
Understanding composite reflectivity maps is crucial for accurate weather analysis and forecasting, enabling meteorologists to interpret storm structures and potential severe weather events effectively.
By leveraging these maps, meteorologists can make informed decisions, issue timely warnings, and enhance public safety during adverse weather conditions.
Incorporating composite reflectivity maps into weather analysis provides a more nuanced understanding of storm dynamics, leading to improved forecasting accuracy and preparedness.
For further reading on composite reflectivity and its applications, consider exploring the following resources:
-
Composite Reflectivity - Warning Decision Training Division (WDTD)
-
Composite Reflectivity - Wikipedia
These resources offer in-depth information on the principles, applications, and limitations of composite reflectivity maps in meteorology.
By understanding and utilizing composite reflectivity maps, meteorologists can enhance their analysis of storm structures and improve the accuracy of weather forecasts, ultimately contributing to better public safety and preparedness.