
Understanding Composite Reflectivity Maps: A Comprehensive Guide
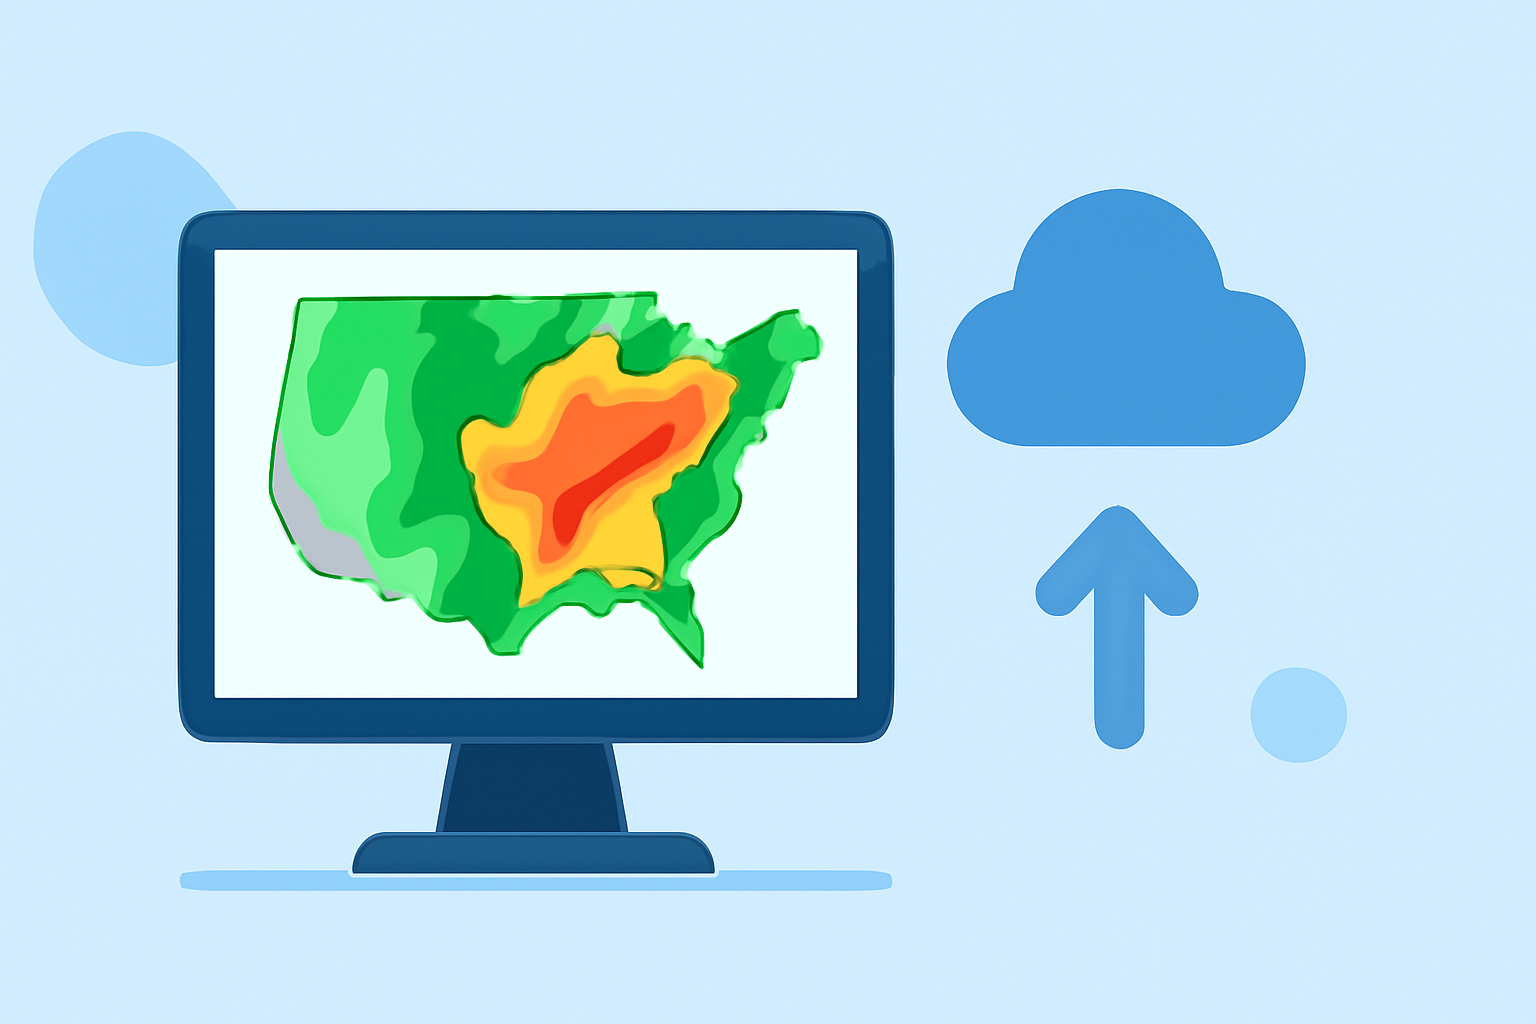
Composite reflectivity maps are essential tools in meteorology, providing a comprehensive view of precipitation intensity and storm structure. By analyzing these maps, meteorologists can assess storm severity, predict weather patterns, and issue timely warnings.
What Are Composite Reflectivity Maps?
Composite reflectivity maps display the maximum radar reflectivity factor (dBZ) observed within a vertical column of the atmosphere. This means that for each point on the ground, the map shows the highest reflectivity value detected at any altitude above that point. This approach offers a comprehensive view of precipitation intensity, capturing the most intense portions of a storm system regardless of its altitude. (prod-01-alb-www-noaa.woc.noaa.gov)
How Are Composite Reflectivity Maps Created?
Weather radars, such as the NEXRAD system, perform volume scans by emitting pulses of energy at various elevation angles. Each scan measures the reflectivity of precipitation particles along a cone-shaped path. The composite reflectivity map compiles the highest reflectivity values from all these scans, providing a unified image of the storm's most intense areas. (prod-01-alb-www-noaa.woc.noaa.gov)
Why Are Composite Reflectivity Maps Important?
These maps are crucial for several reasons:
-
Storm Intensity Assessment: They help meteorologists quickly identify the strongest parts of a storm, which is vital for issuing timely warnings.
-
Precipitation Estimation: By analyzing reflectivity values, meteorologists can estimate rainfall rates and potential flooding risks.
-
Severe Weather Detection: They assist in identifying severe weather phenomena, such as hailstorms or tornadoes, by highlighting areas of intense reflectivity. (prod-01-alb-www-noaa.woc.noaa.gov)
Limitations of Composite Reflectivity Maps
While valuable, composite reflectivity maps have certain limitations:
-
Vertical Resolution: They do not provide information about the vertical structure of precipitation, which can be crucial for understanding storm dynamics.
-
Surface Precipitation: High reflectivity values at higher altitudes may not always correspond to precipitation reaching the ground, as some precipitation can evaporate before reaching the surface. (prod-01-alb-www-noaa.woc.noaa.gov)
Enhancing Interpretation with Clime's Advanced Tools
Clime offers advanced tools that enhance the interpretation of composite reflectivity maps:
-
Integrated Data Analysis: Clime combines composite reflectivity data with other meteorological information, providing a more comprehensive understanding of weather patterns.
-
Real-Time Updates: Clime's platform offers real-time updates, ensuring that users have access to the most current weather information.
-
User-Friendly Interface: Clime's intuitive interface allows users to easily navigate and interpret complex weather data, making it accessible for both professionals and enthusiasts.
Conclusion
Composite reflectivity maps are indispensable in meteorology, offering insights into storm intensity and precipitation patterns. By leveraging Clime's advanced tools, users can enhance their understanding and interpretation of these maps, leading to more informed weather-related decisions.
Highlights:
- Radar Images: Reflectivity | National Oceanic and Atmospheric Administration
- Composite Reflectivity - Warning Decision Training Division (WDTD) - Virtual Lab
- Interpretation of composite reflectivity, Published on Thursday, May 28