
Understanding Composite Reflectivity Maps: A Comprehensive Guide
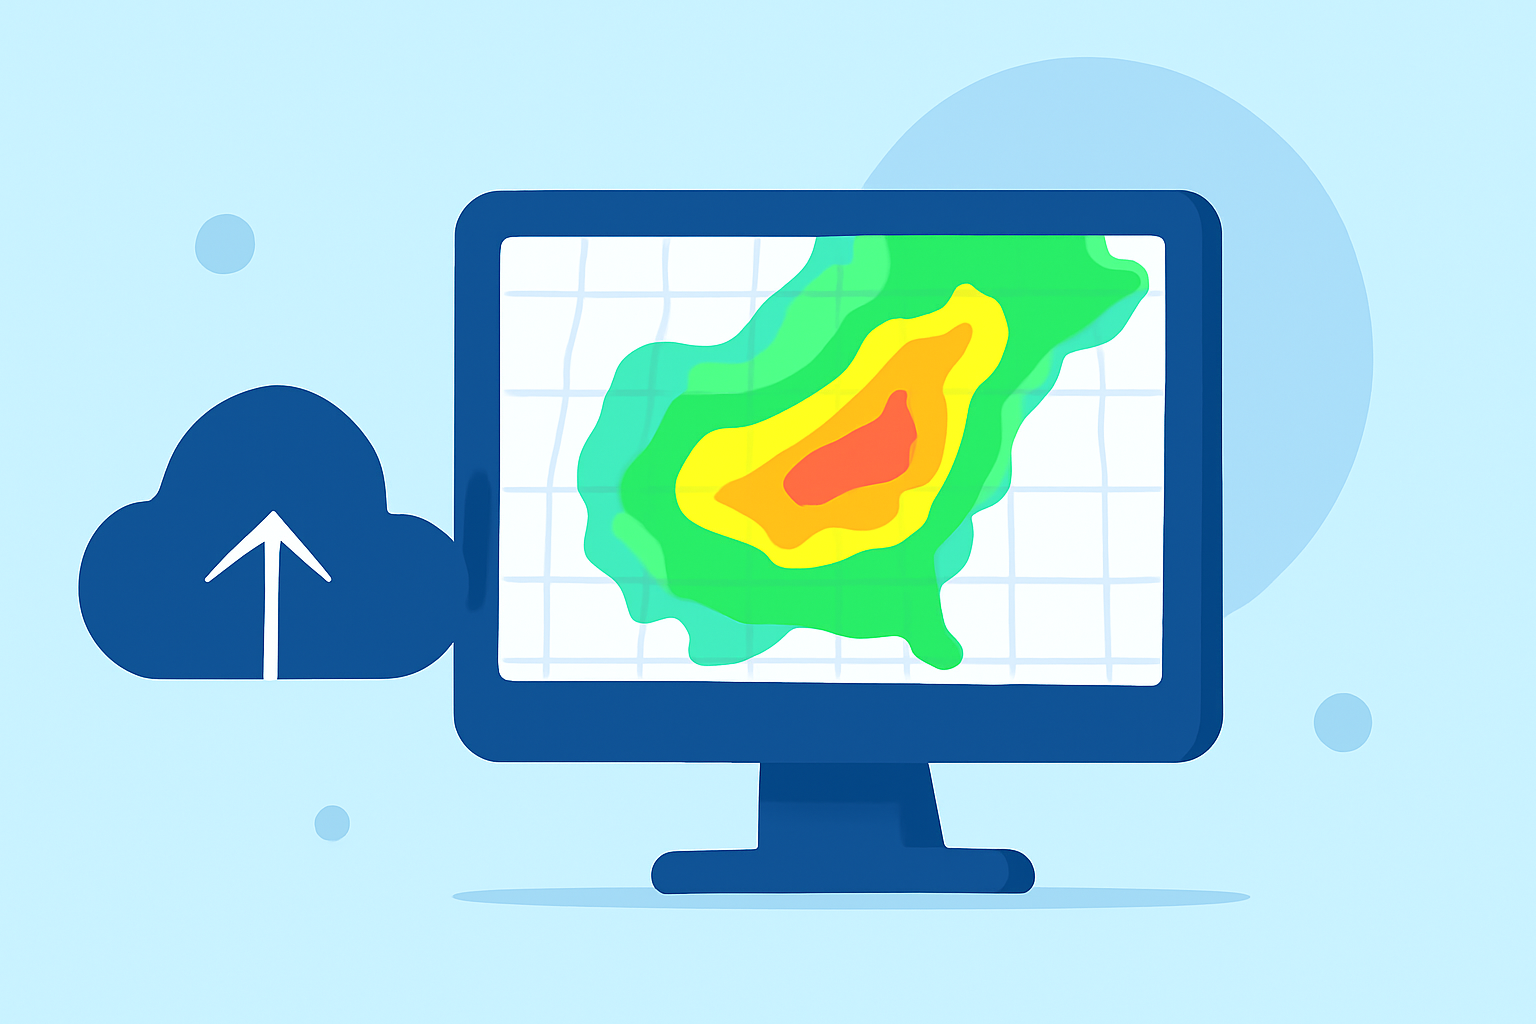
Composite reflectivity maps are essential tools in meteorology, providing a comprehensive view of precipitation intensity and storm structure. By integrating data from multiple radar elevation angles, these maps offer a three-dimensional perspective of weather systems, aiding in accurate forecasting and severe weather detection.
What Are Composite Reflectivity Maps?
Composite reflectivity maps display the maximum reflectivity values from various radar elevation angles, capturing the strongest precipitation signals within a vertical column. This approach allows meteorologists to assess the most intense portions of thunderstorms, even if they occur at higher altitudes, which might be missed in single-angle scans. For instance, while base reflectivity focuses on the lowest elevation angle, composite reflectivity encompasses data from multiple angles, providing a more comprehensive view of storm dynamics. (prod-01-alb-www-noaa.woc.noaa.gov)
How Are Composite Reflectivity Maps Created?
Weather radars perform volume scans by emitting pulses at different elevation angles, typically ranging from 0.5° to 3.5°. Each scan captures precipitation intensity at a specific altitude, resulting in a series of reflectivity values. The composite reflectivity map compiles the highest reflectivity values from these scans, creating a unified image that highlights the most intense precipitation areas. This method ensures that severe weather features, such as strong updrafts or hail-producing cells, are accurately represented. (vlab.noaa.gov)
Interpreting Composite Reflectivity Maps
When analyzing composite reflectivity maps, it's crucial to consider the vertical structure of storms. For example, a high reflectivity value at elevated angles may indicate strong updrafts or hail aloft, which might not reach the ground. Conversely, low-level reflectivity can reveal surface-based features like hook echoes, associated with tornado potential. Therefore, combining composite reflectivity with base reflectivity provides a more accurate assessment of storm severity and potential hazards. (prod-01-alb-www-noaa.woc.noaa.gov)
Limitations of Composite Reflectivity Maps
While composite reflectivity maps are invaluable, they have certain limitations. They may not effectively depict the vertical extent of precipitation, potentially leading to misinterpretations of storm size and intensity. Additionally, these maps can be affected by bright band contamination, where melting snowflakes cause anomalously high reflectivity values, potentially masking the true nature of precipitation. (vlab.noaa.gov)
Enhancing Composite Reflectivity Interpretation with Clime
Clime offers advanced tools that integrate composite reflectivity data with real-time weather information, providing users with a dynamic and interactive experience. By leveraging Clime's platform, meteorologists and weather enthusiasts can access up-to-date composite reflectivity maps, enhancing their ability to monitor and interpret severe weather events effectively. Clime's user-friendly interface and comprehensive data sources make it an invaluable resource for accurate weather forecasting and analysis.
Conclusion
Composite reflectivity maps are fundamental in understanding storm dynamics and precipitation patterns. By integrating data from multiple radar elevation angles, they offer a detailed view of weather systems, aiding in accurate forecasting and severe weather detection. Utilizing platforms like Clime can further enhance the interpretation of these maps, providing users with the tools needed for effective weather analysis.
Highlights:
- Composite Reflectivity - Warning Decision Training Division (WDTD) - Virtual Lab
- Interpretation Guide: COMPOSITE REFLECTIVITY
- Radar Images: Reflectivity | National Oceanic and Atmospheric Administration