
Understanding Composite Reflectivity Maps: A Simplified Guide
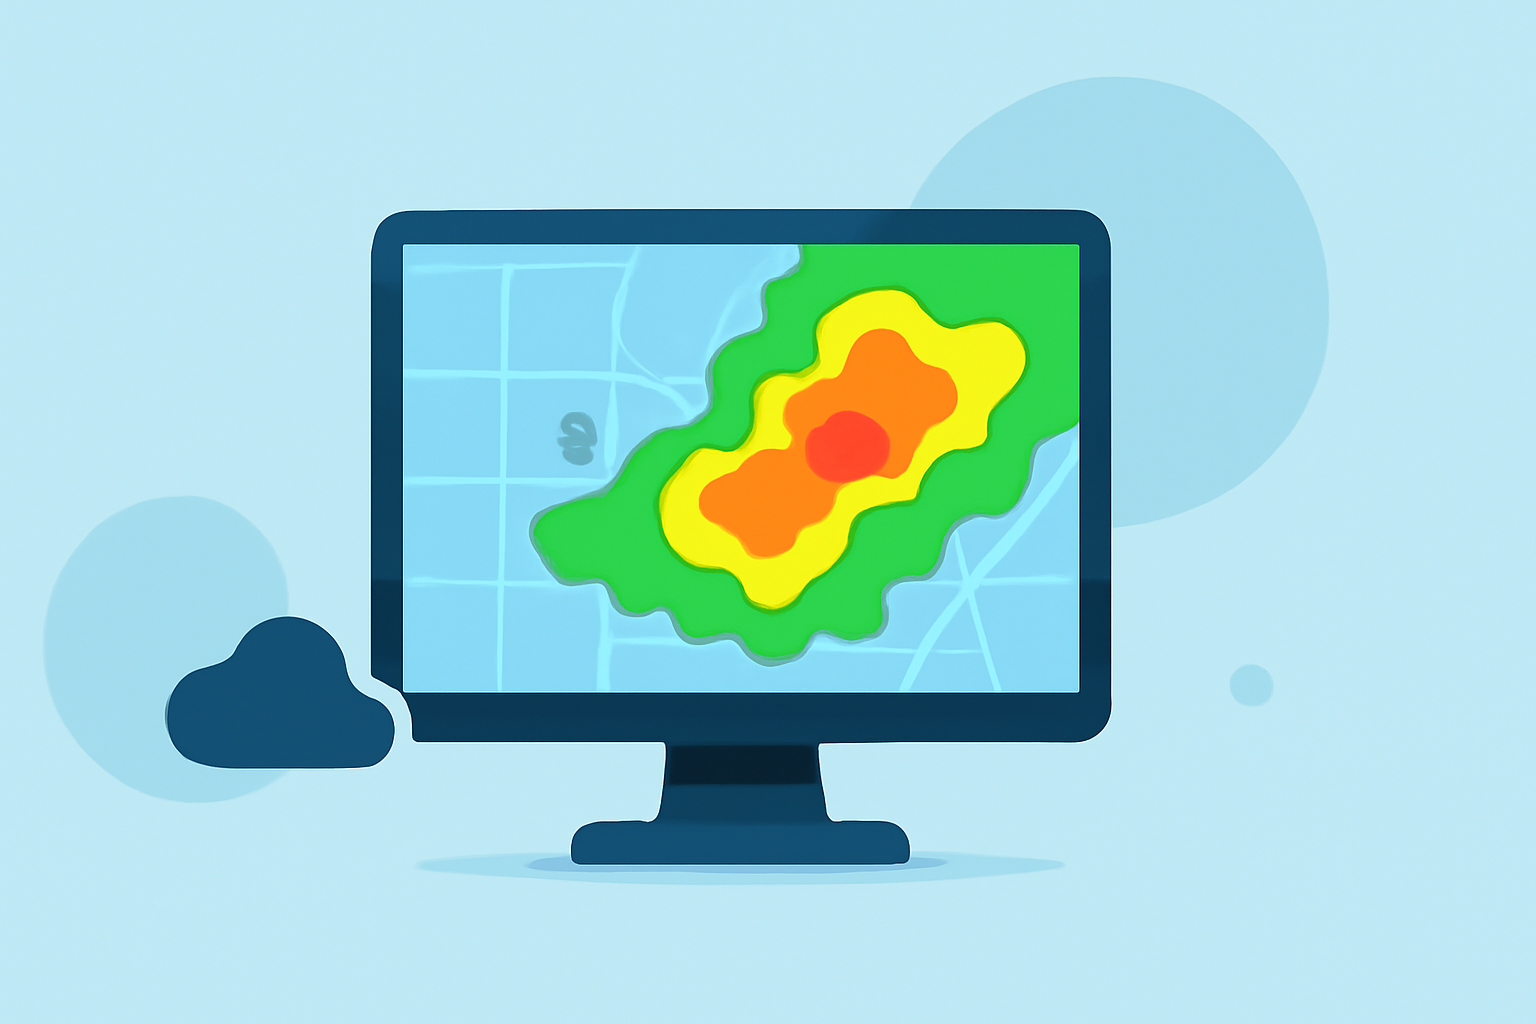
Composite reflectivity maps are essential tools in meteorology, providing a comprehensive view of precipitation intensity and storm structure. By understanding these maps, you can gain valuable insights into weather patterns and potential severe weather events.
What Are Composite Reflectivity Maps?
Composite reflectivity maps display the maximum reflectivity values from various elevation angles of a weather radar. This approach captures the strongest precipitation echoes within a vertical column above each point on the ground, offering a more complete picture of storm intensity and structure. Unlike base reflectivity, which only considers the lowest elevation angle, composite reflectivity incorporates data from higher angles, revealing precipitation that may not reach the ground. (en.wikipedia.org)
How Are Composite Reflectivity Maps Created?
Weather radars emit beams at multiple elevation angles, each scanning a different portion of the atmosphere. The reflectivity at each angle represents the rate of precipitation along that specific path. By compiling the highest reflectivity values from all these angles, composite reflectivity maps are generated, highlighting the most intense precipitation within a vertical column. (en.wikipedia.org)
Why Are Composite Reflectivity Maps Important?
These maps are crucial for several reasons:
-
Enhanced Storm Detection: They help identify developing storms near the radar, which might be missed in base reflectivity images. (prod-01-alb-www-noaa.woc.noaa.gov)
-
Assessing Storm Intensity: By showing the maximum reflectivity, they provide a quick overview of storm strength, aiding in the detection of severe weather conditions. (prod-01-alb-www-noaa.woc.noaa.gov)
-
Monitoring Precipitation Extent: They reveal the horizontal extent of precipitation, including areas where rain may not reach the ground due to evaporation or strong updrafts. (en.wikipedia.org)
How to Interpret Composite Reflectivity Maps?
Interpreting these maps involves understanding the color gradients, which represent different reflectivity values measured in decibels of Z (dBZ). Higher dBZ values indicate more intense precipitation. For example, areas with dBZ values above 50 typically correspond to heavy rainfall or hail. It's important to note that while composite reflectivity maps provide valuable information, they may not reveal the vertical structure of storms, such as hook echoes associated with tornadoes. (prod-01-alb-www-noaa.woc.noaa.gov)
Practical Example: Composite Reflectivity in Action
Consider a scenario where a cluster of thunderstorms is approaching a region. A composite reflectivity map can help identify the most intense parts of the storm, indicating areas with heavy rainfall or potential hail. This information is vital for issuing timely warnings and preparing for severe weather impacts.
How Does Clime Utilize Composite Reflectivity Maps?
Clime leverages composite reflectivity maps to provide users with real-time, accurate weather information. By integrating these maps into our platform, Clime offers enhanced situational awareness, helping users make informed decisions during severe weather events.
Conclusion
Composite reflectivity maps are indispensable in modern meteorology, offering a detailed view of precipitation intensity and storm structure. Understanding how to read and interpret these maps can significantly improve weather forecasting and preparedness.