
Understanding Composite Reflectivity Maps: A Step-by-Step Guide
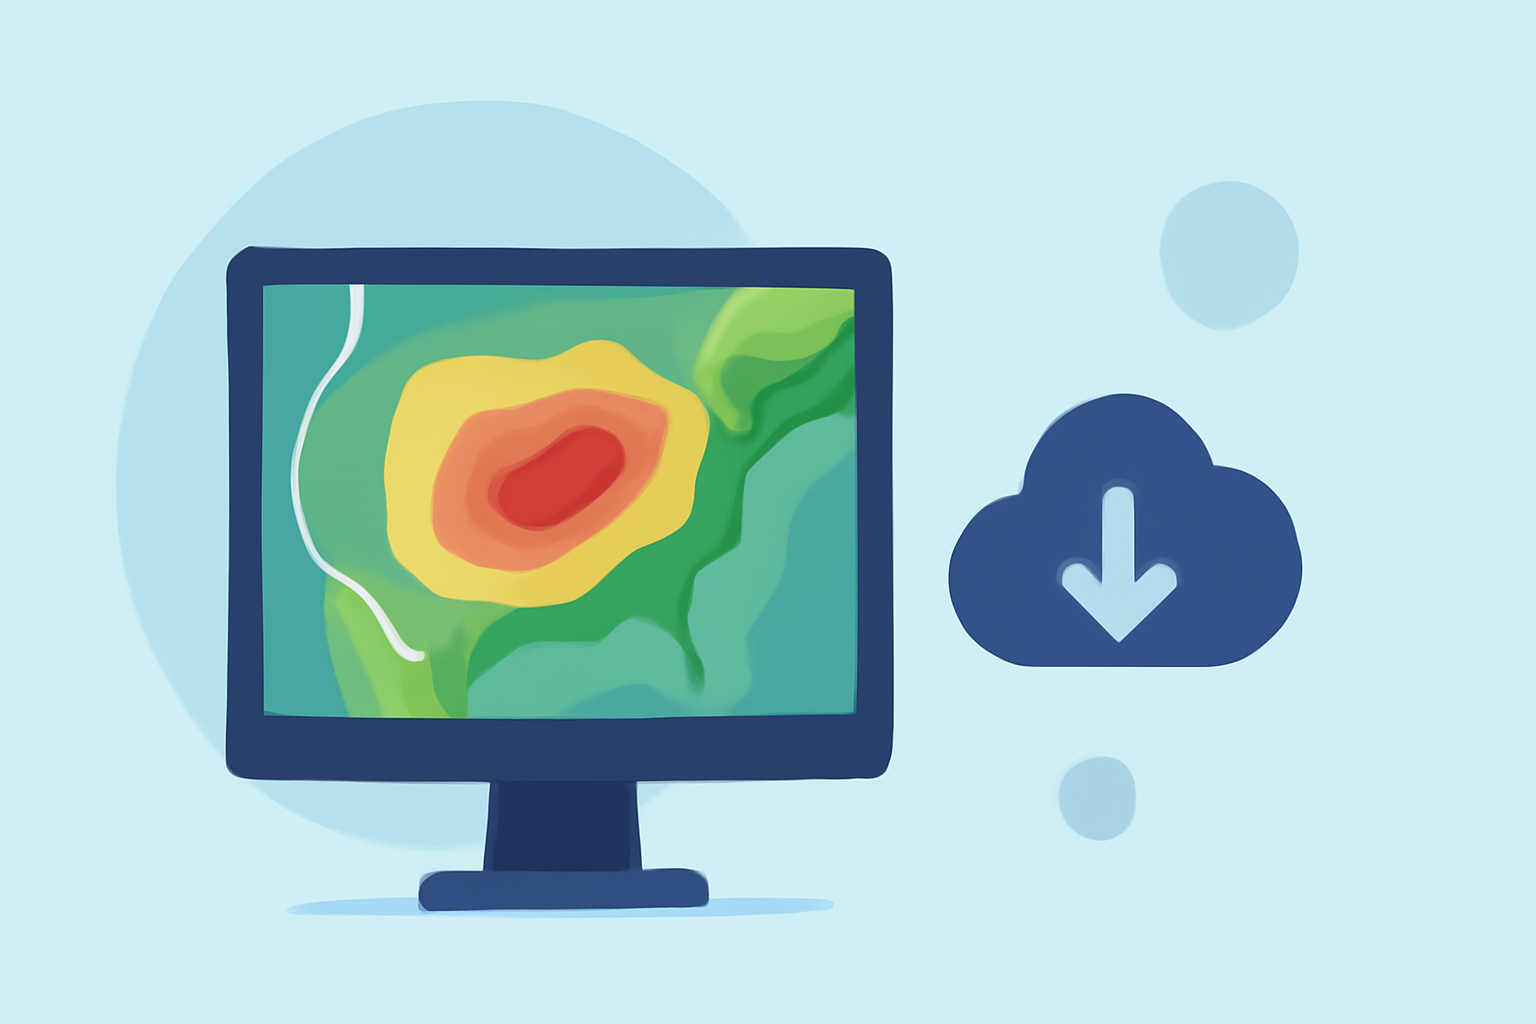
Composite reflectivity maps are essential tools in meteorology, providing a comprehensive view of precipitation intensity and storm structure. By analyzing these maps, meteorologists can make informed decisions about weather patterns and potential hazards.
What Are Composite Reflectivity Maps?
Composite reflectivity maps display the maximum reflectivity values from various elevation angles of a weather radar. This approach captures the strongest precipitation echoes within a vertical column above each point on the ground, offering a three-dimensional perspective of storm structures. Unlike base reflectivity, which represents precipitation intensity at a single elevation angle, composite reflectivity integrates data from multiple angles to present a more accurate depiction of precipitation intensity and storm development. (en.wikipedia.org)
How Are Composite Reflectivity Maps Created?
-
Radar Volume Scan: Weather radars perform volume scans by emitting pulses at different elevation angles, typically ranging from 0.5° to 3.5°. Each scan captures precipitation data along a cone-shaped path extending from the radar.
-
Data Collection: At each elevation angle, the radar measures the reflectivity, which indicates the amount of precipitation present. These measurements are recorded in decibels of Z (dBZ), a logarithmic unit that quantifies the power of the returned radar signal.
-
Data Integration: The highest reflectivity value from each elevation angle is identified for every point on the ground. These maximum values are then compiled to create the composite reflectivity map, highlighting the most intense precipitation echoes within the radar's scanning volume. (en.wikipedia.org)
How Do You Interpret Composite Reflectivity Maps?
-
Color Coding: Composite reflectivity maps use color gradients to represent varying levels of precipitation intensity. Typically, lighter colors indicate lighter precipitation, while darker colors signify heavier precipitation.
-
Identifying Storm Features: By examining the distribution and intensity of reflectivity values, meteorologists can identify storm features such as updrafts, downdrafts, and areas of intense precipitation.
-
Assessing Storm Strength: The presence of strong reflectivity values at higher elevations can indicate powerful updrafts and potential severe weather conditions, such as hail or tornadoes.
What Are the Limitations of Composite Reflectivity Maps?
-
Temporal Resolution: Composite reflectivity maps are generated after the completion of a full volume scan, which can take several minutes. This delay means that rapidly developing storms near the radar may not be immediately detected.
-
Vertical Resolution: While composite reflectivity provides a three-dimensional view, it may not capture fine vertical details of storm structures, potentially missing smaller-scale features.
-
Bright Band Contamination: The melting layer, known as the bright band, can cause anomalously high reflectivity values due to melting snowflakes, which may not accurately represent the precipitation type or intensity at the surface.
How Does Clime Enhance the Use of Composite Reflectivity Maps?
Clime offers advanced weather visualization tools that integrate composite reflectivity data with real-time weather information. This integration allows users to monitor storm development and intensity more effectively, aiding in timely decision-making for weather-related events.
By understanding and utilizing composite reflectivity maps, meteorologists and weather enthusiasts can gain deeper insights into storm dynamics, leading to more accurate forecasts and better preparedness for severe weather events.