
Understanding Composite Reflectivity Maps: A Beginner's Guide
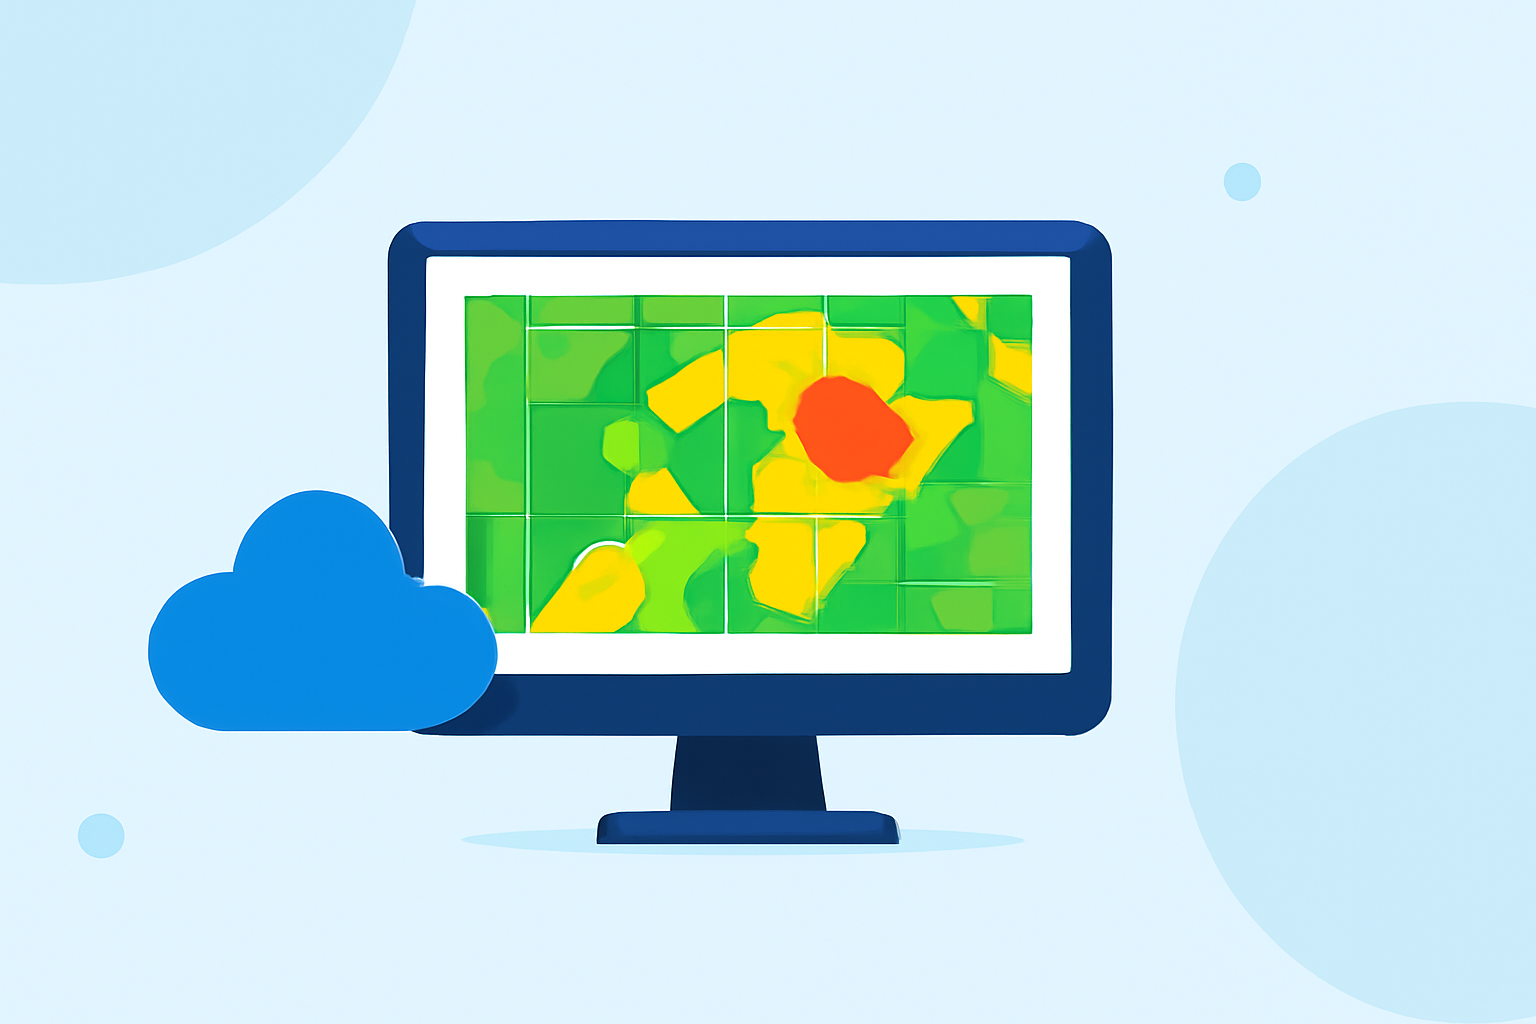
Composite reflectivity maps are essential tools in meteorology, providing a comprehensive view of precipitation intensity and storm structure. These maps display the maximum reflectivity values from weather radar data, offering insights into storm development and severity.
What Are Composite Reflectivity Maps?
Composite reflectivity maps aggregate data from multiple radar scans to present the highest reflectivity observed within a specific area. This approach ensures that the most intense precipitation echoes are highlighted, aiding meteorologists in identifying severe weather conditions. By combining data from various elevation angles, these maps offer a three-dimensional perspective of storm structures, enhancing the understanding of storm dynamics. (vlab.noaa.gov)
How Are They Created?
The creation of composite reflectivity maps involves several key steps:
-
Data Collection: Weather radars emit signals that bounce off precipitation particles, returning with information about the intensity and location of precipitation.
-
Data Aggregation: Multiple radar scans are combined to capture reflectivity data from various angles and elevations, ensuring a comprehensive representation of the storm's structure.
-
Data Processing: Advanced algorithms process the aggregated data to identify the maximum reflectivity values within each grid point, effectively highlighting the most intense precipitation areas. (vlab.noaa.gov)
Applications in Weather Forecasting
Composite reflectivity maps are invaluable in several aspects of weather forecasting:
-
Severe Weather Detection: By highlighting areas of intense precipitation, these maps assist in identifying severe weather phenomena such as thunderstorms, hailstorms, and tornadoes.
-
Storm Tracking: Meteorologists use these maps to monitor storm movement and development, providing critical information for issuing timely warnings.
-
Aviation Safety: Air traffic controllers and pilots rely on composite reflectivity maps to navigate around severe weather, ensuring flight safety. (vlab.noaa.gov)
Limitations of Composite Reflectivity Maps
While composite reflectivity maps are powerful tools, they have certain limitations:
-
Vertical Resolution: These maps may not capture precipitation intensity at lower altitudes, potentially missing developing storms near the radar.
-
Bright Band Contamination: The melting of snowflakes can cause anomalously high reflectivity values, known as the bright band effect, which may not be removed in some composite reflectivity products. (vlab.noaa.gov)
Enhancing Weather Data Interpretation with Clime
Clime offers advanced tools that enhance the interpretation of composite reflectivity maps:
-
Real-Time Data Processing: Clime's platform processes radar data in real-time, providing up-to-date composite reflectivity maps for immediate analysis.
-
High-Resolution Imagery: Clime delivers high-resolution composite reflectivity maps, allowing for detailed examination of storm structures and precipitation patterns.
-
User-Friendly Interface: Clime's intuitive interface enables users to easily navigate and interpret complex weather data, making it accessible for both professionals and enthusiasts.
Conclusion
Composite reflectivity maps are vital in meteorology, offering insights into storm intensity and structure. Understanding their creation, applications, and limitations is essential for accurate weather forecasting. Clime's advanced tools provide enhanced capabilities for interpreting these maps, supporting informed decision-making in weather-related scenarios.
Highlights:
- Next Generation Weather Radar (NEXRAD) | National Centers for Environmental Information (NCEI)
- About our WSR 88-D Radar