
Understanding Composite Reflectivity Maps: A Beginner's Guide
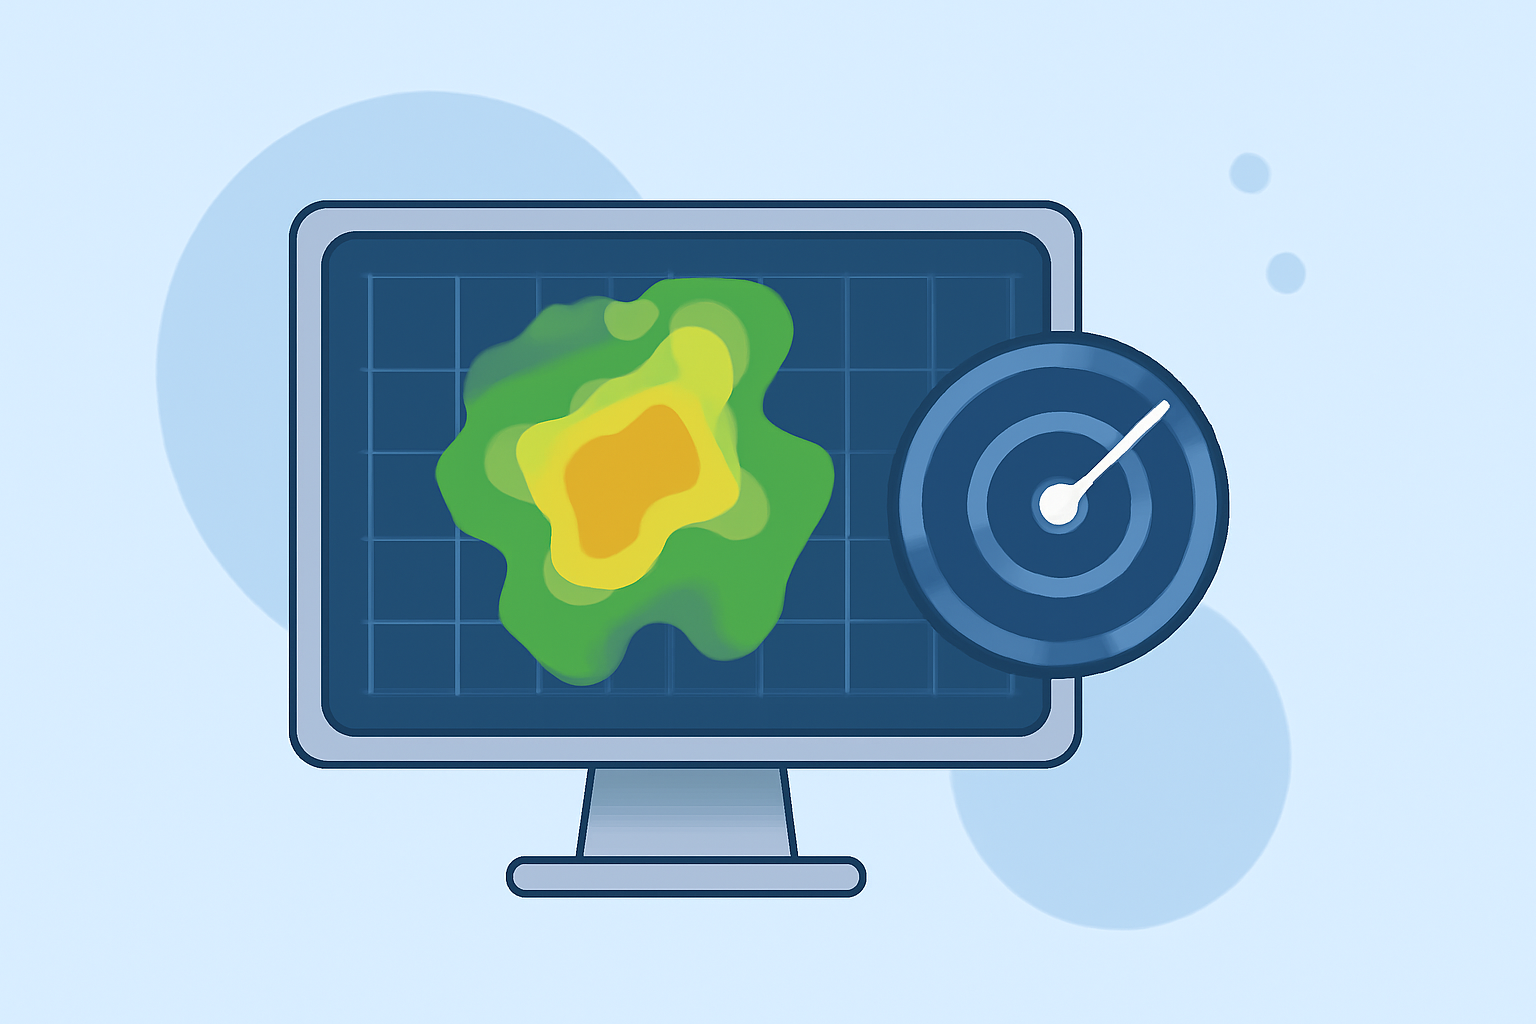
Composite reflectivity maps are essential tools in meteorology, providing a visual representation of precipitation intensity and storm structure. These maps display the maximum reflectivity values detected by weather radar systems, offering insights into storm development and severity.
What Are Composite Reflectivity Maps?
Composite reflectivity maps compile the highest reflectivity values from various radar scans, presenting a comprehensive view of precipitation intensity over a specific area. Unlike base reflectivity, which shows precipitation at a single elevation angle, composite reflectivity integrates data from multiple angles, capturing the most intense precipitation within a vertical column above each point on the ground. (prod-01-alb-www-noaa.woc.noaa.gov)
How Are They Created?
Weather radar systems, such as the NEXRAD network, perform volume scans by emitting radar beams at different elevation angles. Each scan measures the reflectivity of precipitation particles, which correlates with their size and concentration. The composite reflectivity map is generated by selecting the highest reflectivity value from these scans for each location, effectively highlighting the most intense precipitation present. (prod-01-alb-www-noaa.woc.noaa.gov)
Interpreting Composite Reflectivity Maps
When viewing a composite reflectivity map, areas with higher reflectivity values are typically colored in shades of red or purple, indicating heavier precipitation. Conversely, lower reflectivity values are shown in green or blue, representing lighter precipitation. This color-coding allows meteorologists and the public to quickly assess the severity and distribution of precipitation. (prod-01-alb-www-noaa.woc.noaa.gov)
Applications in Weather Forecasting
Composite reflectivity maps are invaluable for:
-
Identifying Storm Development: They help in detecting the initial formation of thunderstorms and monitoring their growth.
-
Assessing Storm Intensity: By highlighting areas of intense precipitation, they assist in evaluating the potential severity of storms.
-
Monitoring Severe Weather: They are crucial in tracking severe weather events like squall lines or multicell storms, aiding in timely warnings and preparedness. (prod-01-alb-www-noaa.woc.noaa.gov)
Limitations to Consider
While composite reflectivity maps are powerful tools, they have certain limitations:
-
Altitude Ambiguity: They do not specify the altitude at which the maximum reflectivity occurs, which can be important for understanding storm dynamics.
-
Bright Band Contamination: They may include reflectivity from melting snowflakes, known as the bright band, which can lead to overestimation of precipitation rates. (prod-01-alb-www-noaa.woc.noaa.gov)
Enhancing Your Understanding
To effectively interpret composite reflectivity maps, consider the following steps:
-
Familiarize Yourself with Radar Data: Understand the basics of how radar systems work and the significance of reflectivity values.
-
Learn the Color Schemes: Recognize the color codes used to represent different reflectivity levels.
-
Stay Updated: Regularly consult composite reflectivity maps during severe weather events to monitor changes and make informed decisions.
By integrating composite reflectivity maps into your weather monitoring routine, you can gain a clearer picture of precipitation patterns and storm developments, leading to better preparedness and safety.
Highlights:
- Radar Images: Reflectivity | National Oceanic and Atmospheric Administration
- Windy: Weather Radar: The Science Behind the Colorful Images We See Practically Every Day
- What's The Difference Between Composite And Base Radar, And Which One Should You Use For Flying? | Boldmethod, Published on Saturday, February 24