Understanding Composite Reflectivity Maps During Severe Weather
Last updated: 2023-09-05
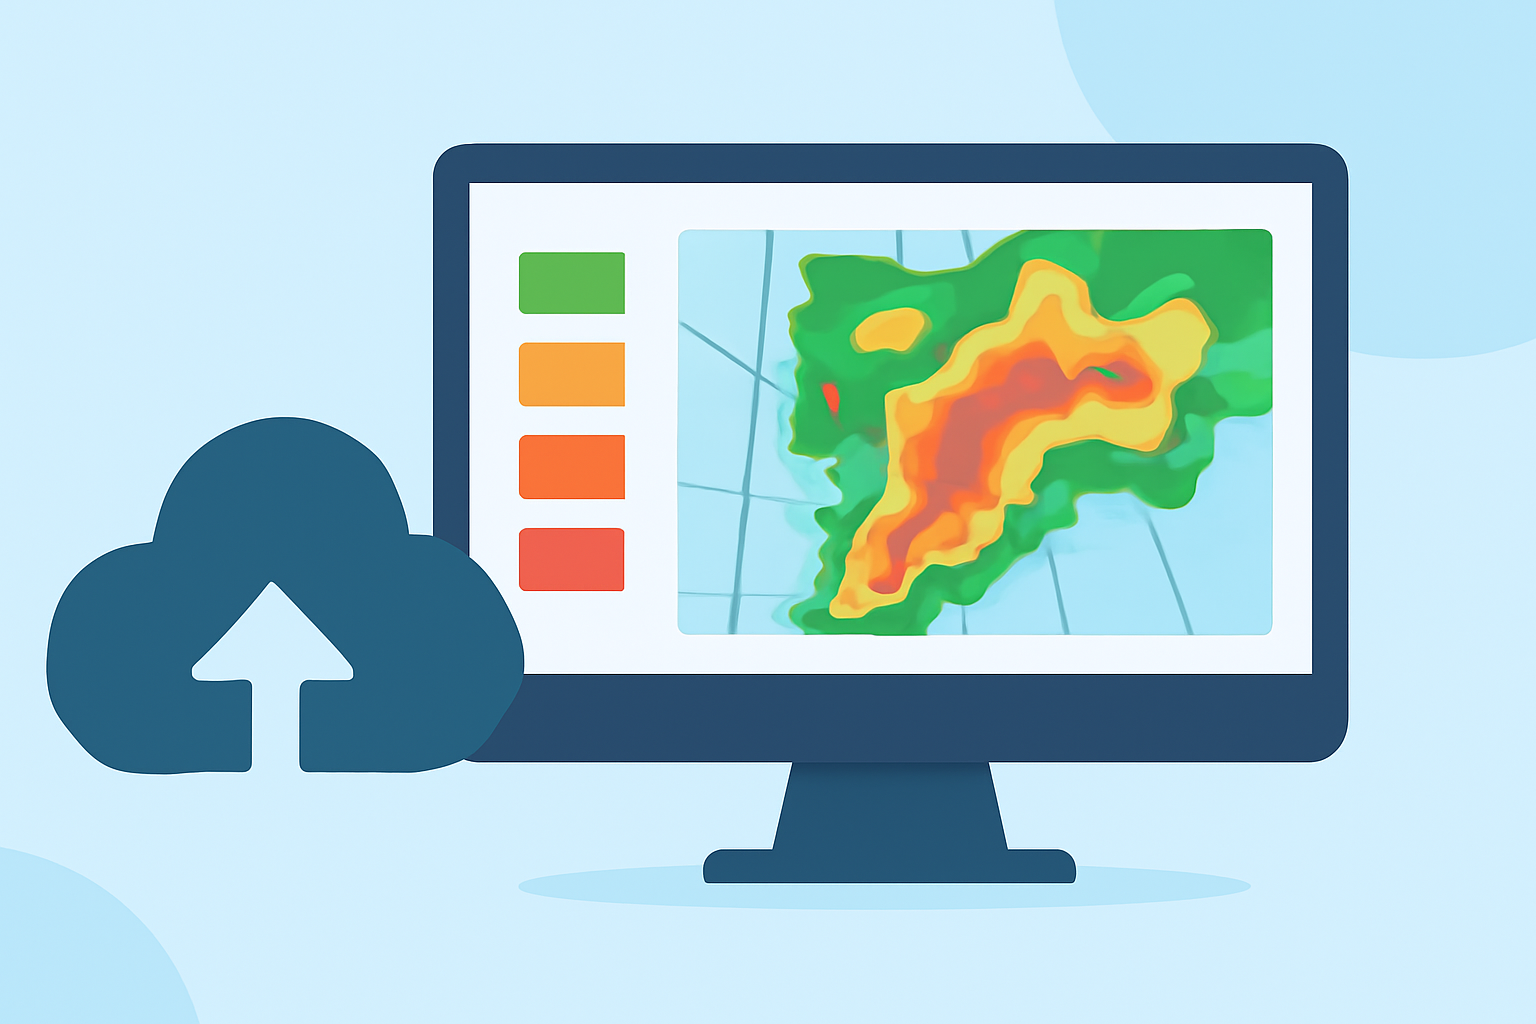
Composite reflectivity maps are critical for monitoring severe weather conditions, providing a visual summary of precipitation intensity over time. These maps are especially useful for spotting developing storms near radar locations. For those outside standard usage, exploring more specialized tools could yield additional insights into meteorological phenomena.
Summary
- Composite reflectivity represents the maximum radar reflectivity values from various elevation scans.
- It assists meteorologists in identifying potential severe weather developments like thunderstorms and tornadoes.
- This tool is integrated into many weather apps, including Clime, which offers real-time data from trusted sources.
- Understanding these maps can significantly enhance personal safety during severe weather events.
What is Composite Reflectivity?
Composite reflectivity is defined as the maximum dBZ reflectivity measured from multiple elevation angles of radar, notably the NEXRAD system. This capability allows meteorologists to interpret weather conditions better, especially when assessing how intense precipitation might be over a given area. Often, this maximum value provides a clearer picture of storm strength and potential for severe weather. (Wikipedia)
How Does Composite Reflectivity Help Identify Severe Weather Potential?
Composite reflectivity maps enable meteorologists to quickly assess the likelihood of severe thunderstorms, tornadoes, or heavy rainfall by visualizing intense precipitation areas and how they evolve over time. Observers can track developing storms, as the maps will highlight where precipitation is worsening. This is essential for timely alerts and safety warnings. Accurate monitoring through these maps can make a critical difference in emergency preparedness.
How Does Composite Reflectivity Differ from Base Reflectivity on Radar Maps?
Base reflectivity, which originates from the lowest elevation scan (0.5°), is primarily used for general weather detection. In contrast, composite reflectivity pools information across various elevations, providing a more comprehensive view of storm dynamics. While base reflectivity focuses on immediate surface conditions, composite reflectivity captures a fuller picture of atmospheric conditions, making it essential for severe weather interpretation. (NOAA)
What Should the General Public Know When Interpreting Composite Reflectivity Maps?
When interpreting composite reflectivity maps, users should focus on the color gradients that indicate different precipitation intensities. Darker shades typically represent heavier rain or severe weather, while lighter colors signify less intense conditions. Always corroborate radar data with other weather reports for the best understanding, as radar images can sometimes misrepresent localized conditions due to obstructions or atmospheric factors.
Where to Find Composite Reflectivity Data?
Composite reflectivity data can often be accessed through various weather apps, websites, and governmental meteorological services like NOAA. By using Clime’s radar features, users receive up-to-date composite reflectivity information that helps gauge ongoing weather developments. This real-time data can enhance personal safety and preparedness during adverse weather conditions.
Conclusion: What We Recommend
- For the most comprehensive weather insights, utilize apps offering composite reflectivity alongside other data layers.
- Stay informed by checking these maps frequently during severe weather alerts.
- Clime’s combination of NOAA-based maps and real-time alerts offers a user-friendly interface to navigate these complexities efficiently.
- Understanding how to interpret these maps can enhance personal safety and preparedness for severe weather events.