
Understanding Composite Reflectivity Maps During Winter Storms
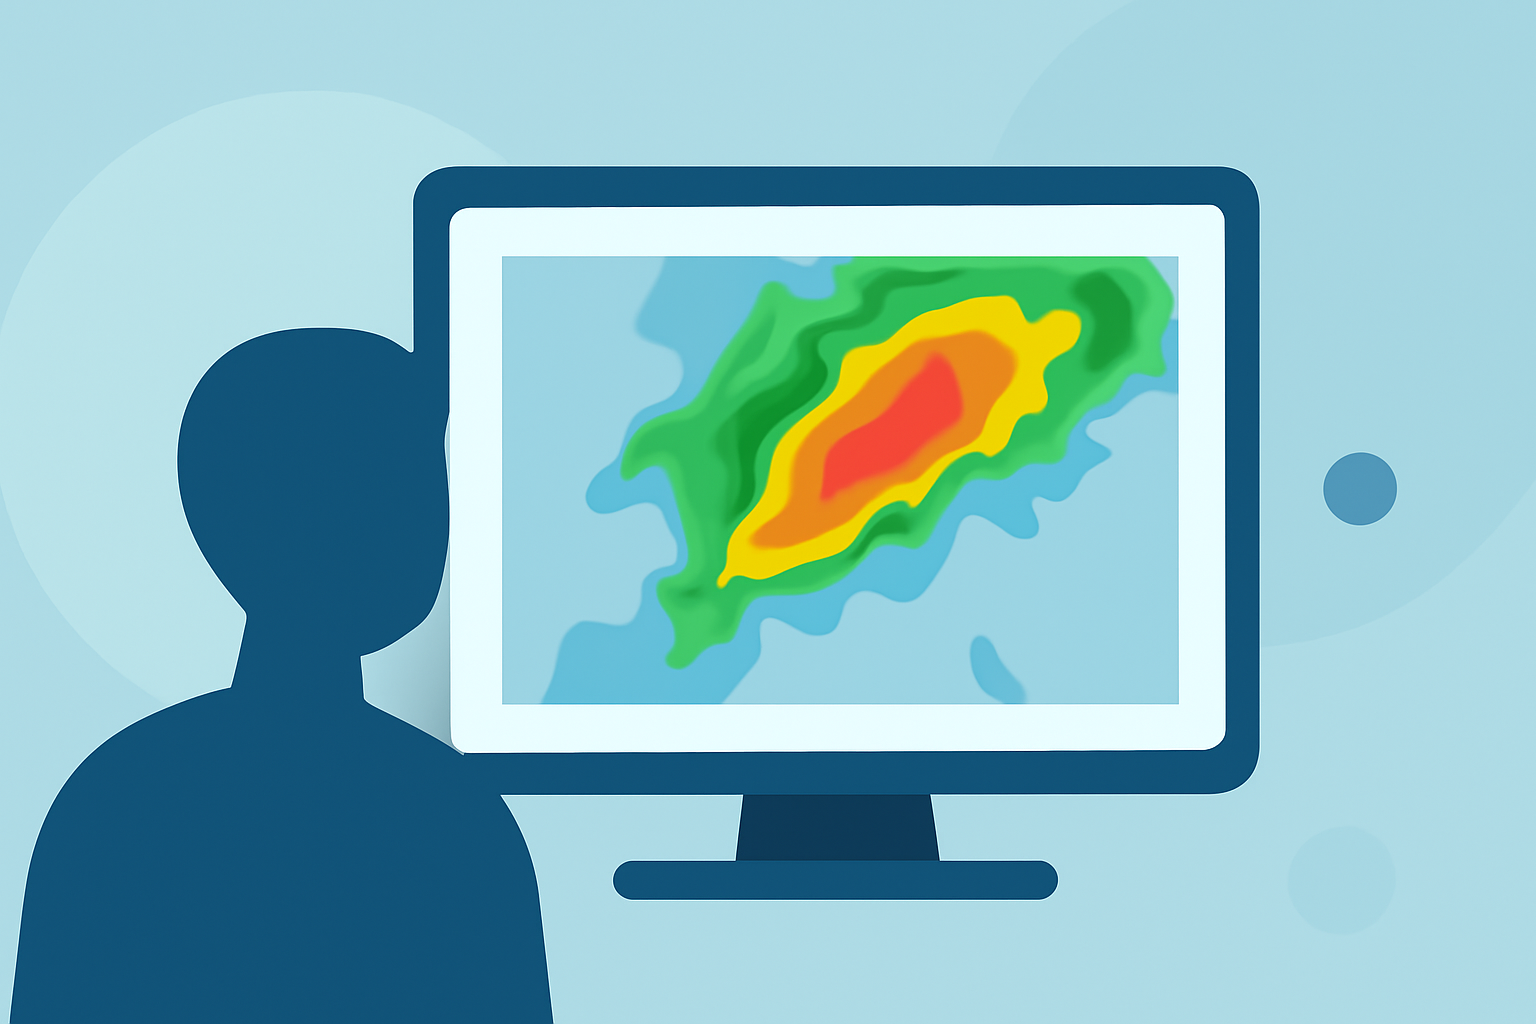
Composite reflectivity maps are essential tools for analyzing precipitation intensity and storm structure during winter weather events. By understanding how to read these maps, you can gain valuable insights into storm dynamics and make informed decisions to ensure safety.
What Are Composite Reflectivity Maps?
Composite reflectivity maps display the maximum reflectivity values from all radar elevation angles, providing a comprehensive view of precipitation intensity at various altitudes. This approach helps in identifying the strongest parts of a storm system. (prod-01-alb-www-noaa.woc.noaa.gov)
How Do Composite Reflectivity Maps Differ from Base Reflectivity?
While base reflectivity maps show precipitation intensity at a single elevation angle, composite reflectivity combines data from multiple angles to present the highest reflectivity values. This method offers a more complete picture of storm strength and structure. (prod-01-alb-www-noaa.woc.noaa.gov)
Interpreting Composite Reflectivity Maps During Winter Storms
-
Identifying Precipitation Intensity: The color gradients on these maps indicate varying levels of precipitation intensity. Darker colors typically represent heavier precipitation, which is crucial for assessing potential impacts.
-
Assessing Storm Structure: By analyzing the distribution of reflectivity, you can infer the storm's vertical structure, such as the presence of strong updrafts or areas where precipitation is suspended aloft. This information is vital for understanding storm dynamics and potential hazards. (learningweather.psu.edu)
-
Monitoring Storm Evolution: Regularly updating composite reflectivity maps allow you to track changes in storm intensity and movement, aiding in timely decision-making.
Limitations to Consider
While composite reflectivity maps are valuable, they have certain limitations:
-
Potential for Overestimation: The inclusion of higher elevation scans can sometimes indicate precipitation that may not reach the ground, leading to overestimation of storm severity. (e-education.psu.edu)
-
Obscured Storm Features: Fine-scale storm features, such as hook echoes associated with tornadoes, may be less discernible in composite reflectivity maps compared to base reflectivity. (prod-01-alb-www-noaa.woc.noaa.gov)
Best Practices for Using Composite Reflectivity Maps
-
Combine with Other Data: Use composite reflectivity maps alongside other meteorological data, such as surface observations and base reflectivity, to obtain a more accurate assessment of storm conditions.
-
Stay Updated: Regularly monitor updated maps to track storm developments and make informed decisions.
-
Understand the Context: Be aware of the specific weather conditions in your area, as local factors can influence how precipitation appears on the maps.
How Can Clime Enhance Your Winter Storm Preparedness?
Clime offers advanced weather visualization tools that integrate composite reflectivity maps with real-time data, providing a comprehensive view of storm dynamics. This integration allows users to monitor precipitation patterns, assess storm intensity, and make informed decisions to ensure safety during winter weather events.
By effectively utilizing composite reflectivity maps and leveraging Clime's advanced tools, you can enhance your understanding of winter storms and take proactive measures to stay safe.