
Understanding Composite Reflectivity Maps: Examples and Applications
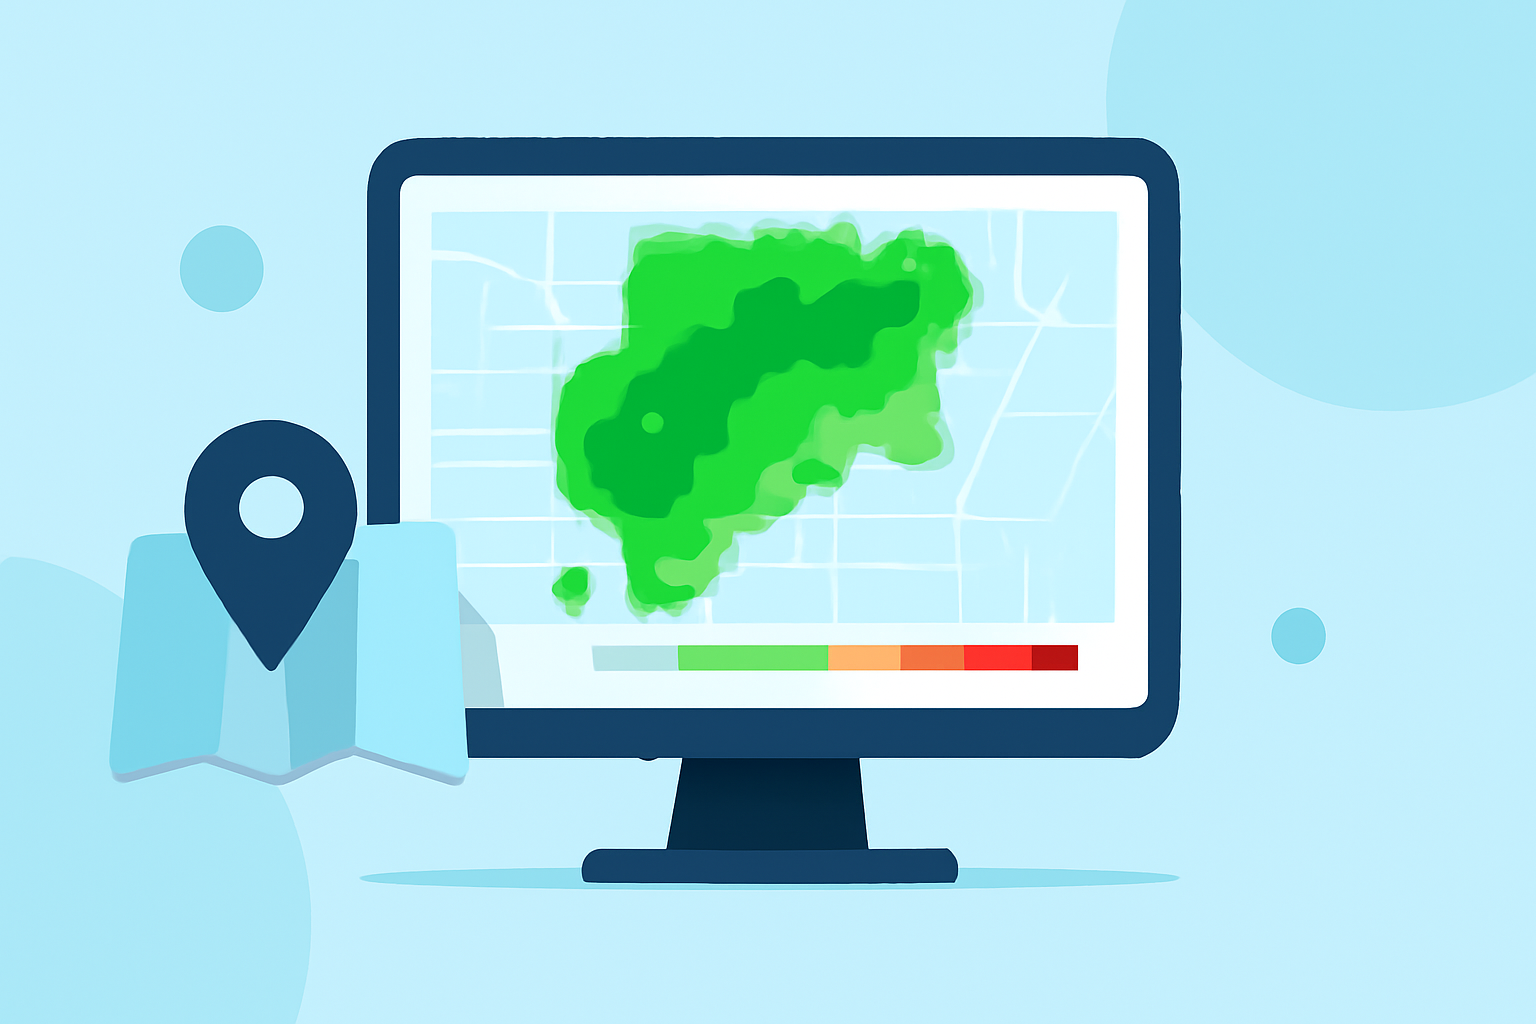
Composite reflectivity maps are essential tools in meteorology, providing a comprehensive view of precipitation intensity and storm structure. By integrating data from multiple radar sources, these maps offer a more accurate and timely depiction of weather conditions, which is crucial for effective forecasting and public safety.
What Are Composite Reflectivity Maps?
Composite reflectivity maps display the maximum reflectivity within a vertical column of the atmosphere, combining data from all available radar sources. This integration allows meteorologists to observe the most intense precipitation areas, even if they occur at different altitudes. The resulting imagery is invaluable for identifying severe weather events such as thunderstorms, hailstorms, and tornadoes.
How Are Composite Reflectivity Maps Created?
The creation of composite reflectivity maps involves several key steps:
-
Data Collection: Multiple radar systems, such as the WSR-88D (Weather Surveillance Radar-1988 Doppler), collect reflectivity data at various elevations.
-
Data Integration: The reflectivity values from these radars are combined to form a three-dimensional (3D) reflectivity cube, capturing the intensity of precipitation at different heights.
-
Composite Generation: The maximum reflectivity value within each vertical column is selected to create the composite map, highlighting the strongest precipitation areas.
This process ensures that the composite reflectivity map provides a comprehensive and accurate representation of precipitation intensity across the entire atmosphere.
Examples of Composite Reflectivity Maps
Composite reflectivity maps are utilized in various meteorological applications:
-
Severe Weather Detection: By identifying areas of intense precipitation, these maps help in detecting severe weather events like thunderstorms and hailstorms.
-
Flight Planning: Air traffic controllers use composite reflectivity maps to assess weather conditions along flight paths, ensuring safe routing.
-
Public Safety: Emergency services rely on these maps to prepare for and respond to severe weather events, enhancing public safety.
Limitations of Composite Reflectivity Maps
While composite reflectivity maps are powerful tools, they have certain limitations:
-
Vertical Resolution: The maps may not capture precipitation intensity at specific altitudes, potentially missing severe weather occurring at higher or lower levels.
-
Bright Band Contamination: The melting layer of snowflakes can cause anomalously high reflectivity values, leading to potential misinterpretation of precipitation intensity.
Enhancing Composite Reflectivity Maps with Clime
Clime offers advanced tools that enhance the utility of composite reflectivity maps:
-
High-Resolution Data: Clime provides high-resolution composite reflectivity maps, offering detailed insights into precipitation patterns.
-
Real-Time Updates: With Clime, users receive near-real-time updates, ensuring timely information for decision-making.
-
User-Friendly Interface: Clime's intuitive interface allows users to easily interpret complex meteorological data, making it accessible for both professionals and the general public.
By leveraging Clime's advanced tools, users can gain a more accurate and comprehensive understanding of weather patterns, leading to better preparedness and response to weather-related events.