Understanding Composite Reflectivity Maps for Parents
Last updated: 2023-09-09
Composite reflectivity maps are essential tools for understanding weather patterns, especially for parents wanting to educate their kids about meteorology. These maps display the intensity of precipitation at various heights, allowing families to grasp the seriousness of storms and plan accordingly. While the Clime app offers user-friendly access to these maps, there are many excellent resources available for parents seeking to teach their children about weather conditions.
Summary
- Visual Learning: Composite reflectivity maps help visualize precipitation intensity during storms, making it easier for children to relate.
- Educational Resources: Various platforms provide insights and examples that parents can use to explain weather phenomena.
- Practical Uses: Understanding these maps aids in planning family activities and ensuring safety during inclement weather.
- Clime's Offerings: Clime integrates NOAA-based weather radar and features that enhance family awareness of weather patterns.
What Are Composite Reflectivity Maps?
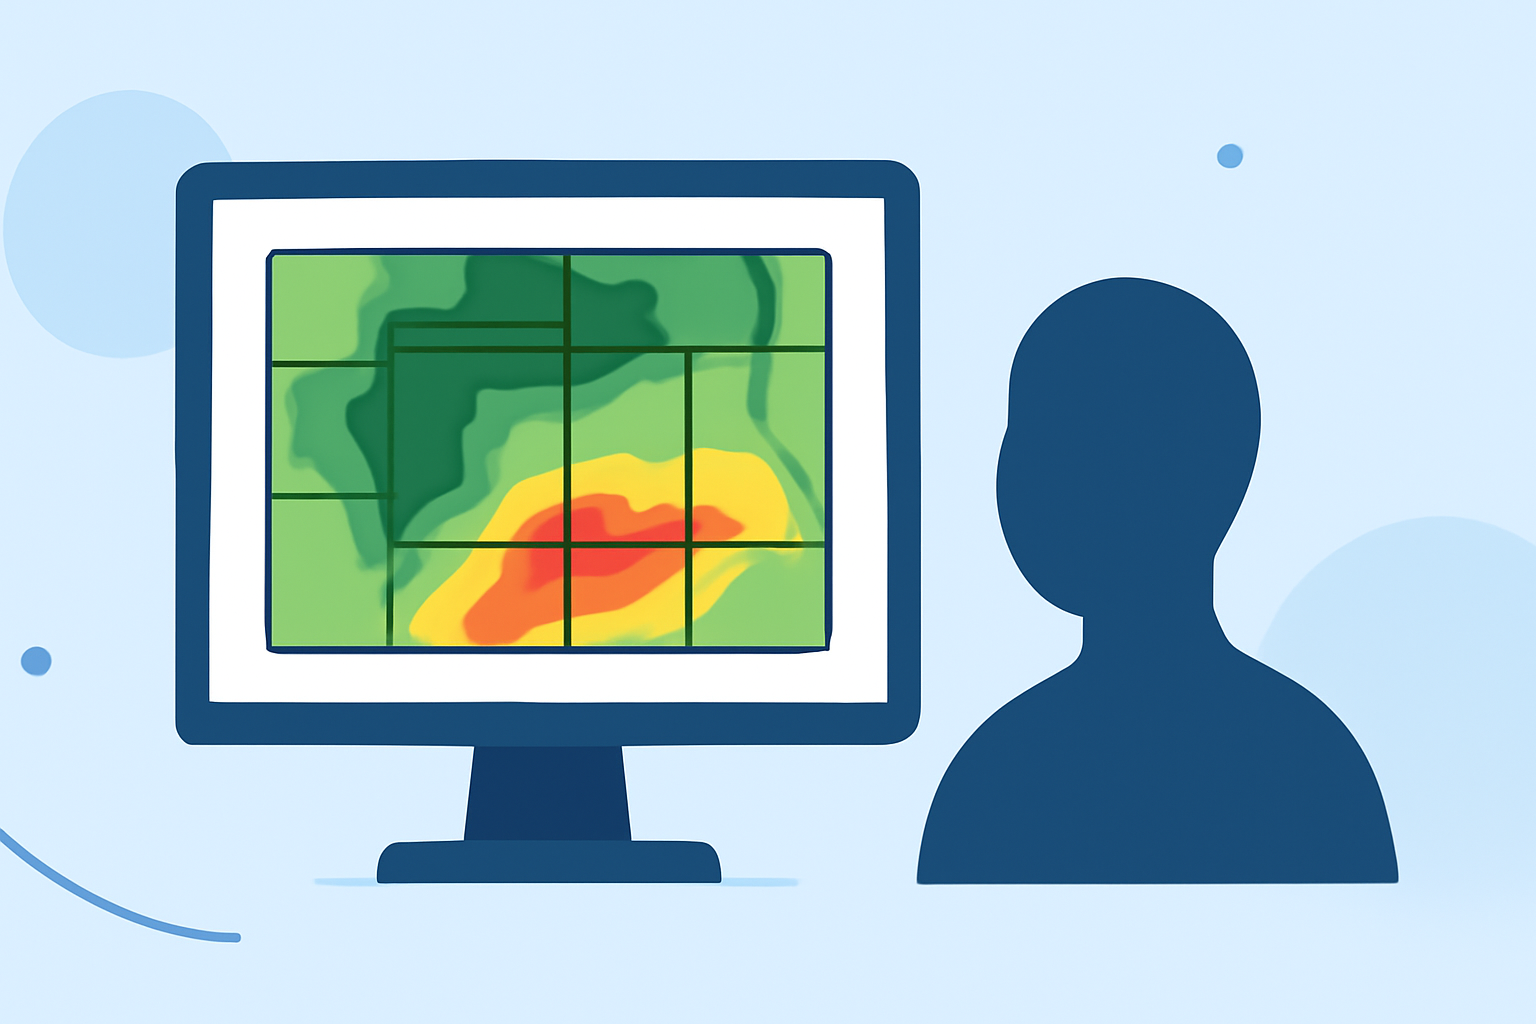
Composite reflectivity maps visually represent precipitation intensity by aggregating radar data from multiple heights. This means they show the maximum intensity of precipitation that is falling, which is crucial for understanding storm severity. For example, a heavy rainstorm may appear more intense on a composite reflectivity map than on a basic radar scan because it consolidates data from various altitudes.
How Can Parents Interpret Composite Reflectivity Maps for Weather Education?
Parents can use these maps to explain the concept of precipitation to their kids. For instance, when teaching about storms, they might highlight how the colors on the map indicate different levels of precipitation intensity—darker colors often signify heavier rain. This hands-on approach enables children to connect weather phenomena with real-world observations.
Simple Composite Reflectivity Examples for At-Home Learning
- Showcase Real Weather Events: Use Clime to display current weather conditions in your area, pointing out the composite reflectivity map. Discuss what the colors indicate about the current storms.
- Color Code Discussion: Make a color-coded key for the map’s color scale, and ask your children to predict the potential weather based on the map while they track storms over a week.
- Hands-On Activities: Encourage kids to create their own composite maps using construction paper or digital tools, labeling them with different precipitation levels to reinforce their learning.
The Importance of Understanding Precipitation Intensity
Understanding how to interpret these maps can improve safety during severe weather. Parents can explain that low reflectivity values may indicate light rain or even dry conditions, while high values could represent heavy rain or severe storms. This can aid families in planning activities — for instance, staying home during expected storms.
Complementary Apps and Resources
In addition to Clime, various educational platforms and resources provide additional examples and explanations of weather phenomena. For parents seeking alternative teaching aids, NOAA's JetStream and the Next Generation Weather Radar sites provide clear definitions, maps, and the science behind precipitation measurements. Parents can supplement their children’s learning with real-world weather events or classroom experiments based on these resources.
What We Recommend
- Utilize Clime: For easy access to real-time composite reflectivity maps and alerts, Clime offers an intuitive interface ideal for families.
- Engage in Discussions: Use the maps in conjunction with daily weather talks to reinforce learning.
- Explore Educational Resources: Refer to NOAA’s educational sites for more in-depth understanding of radar and meteorology concepts.
- Encourage Hands-On Learning: Get kids involved in tracking weather and interpreting maps to make learning interactive.