
Understanding Composite Reflectivity Maps: A Step-by-Step Guide
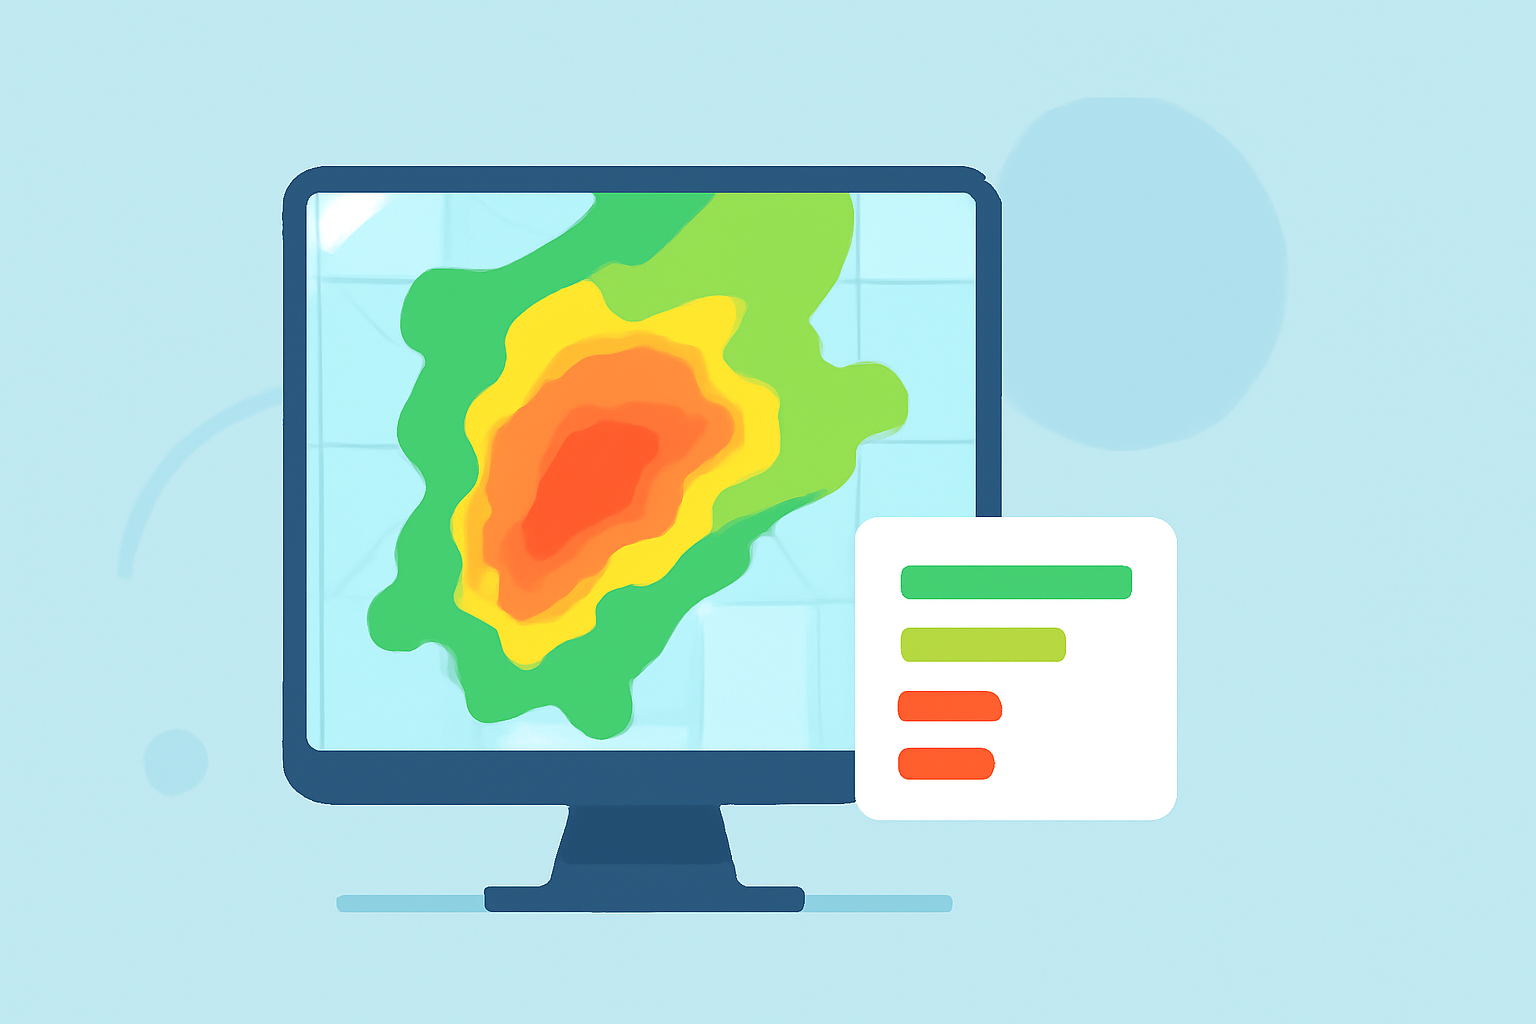
Composite reflectivity maps are essential tools in meteorology, providing a comprehensive view of precipitation intensity and aiding in severe weather prediction. By integrating data from multiple radar scans at various elevations, these maps offer a detailed representation of atmospheric conditions.
What Are Composite Reflectivity Maps?
Composite reflectivity maps display the maximum reflectivity values from multiple radar scans at different elevations, capturing the highest precipitation intensity within a vertical column. This approach enhances the detection of severe weather phenomena, such as thunderstorms and heavy rainfall, by presenting a more accurate depiction of precipitation structures. (en.wikipedia.org)
How Are Composite Reflectivity Maps Created?
-
Radar Data Collection: Weather radars emit signals at various elevation angles, each capturing reflectivity data at different heights.
-
Data Integration: The highest reflectivity value from each vertical column is selected, combining data from all available elevation angles.
-
Map Generation: The integrated data is processed to create a composite reflectivity map, highlighting areas of significant precipitation. (vlab.noaa.gov)
How to Interpret Composite Reflectivity Maps?
-
Color Coding: Typically, colors range from light to dark, with darker shades indicating higher reflectivity and, consequently, more intense precipitation.
-
Identifying Severe Weather: Areas with exceptionally high reflectivity values may indicate severe weather conditions, such as hail or heavy rainfall.
-
Analyzing Storm Structure: The distribution and intensity of reflectivity can reveal storm dynamics, including updrafts and downdrafts.
Applications of Composite Reflectivity Maps
-
Severe Weather Forecasting: By analyzing these maps, meteorologists can predict the development and movement of severe weather systems, issuing timely warnings.
-
Aviation Safety: Pilots use composite reflectivity maps to navigate around areas of heavy precipitation, ensuring flight safety.
-
Flood Prediction: Intense rainfall indicated on these maps can help in forecasting potential flooding events.
Limitations of Composite Reflectivity Maps
-
Beam Blockage: Terrain or buildings can obstruct radar signals, leading to incomplete data in certain areas.
-
Data Interpretation: High reflectivity values do not always correlate with ground-level precipitation, as some precipitation may evaporate before reaching the surface.
Enhancing Your Understanding with Clime
Clime offers advanced tools for analyzing composite reflectivity maps, providing real-time data and intuitive interfaces for both professionals and enthusiasts. Its features include customizable overlays, historical data comparison, and integration with other meteorological data sources, facilitating comprehensive weather analysis.
By mastering the interpretation of composite reflectivity maps, you can gain deeper insights into weather patterns, leading to more accurate forecasts and informed decision-making.