
Understanding Composite Reflectivity Maps in Weather Analysis
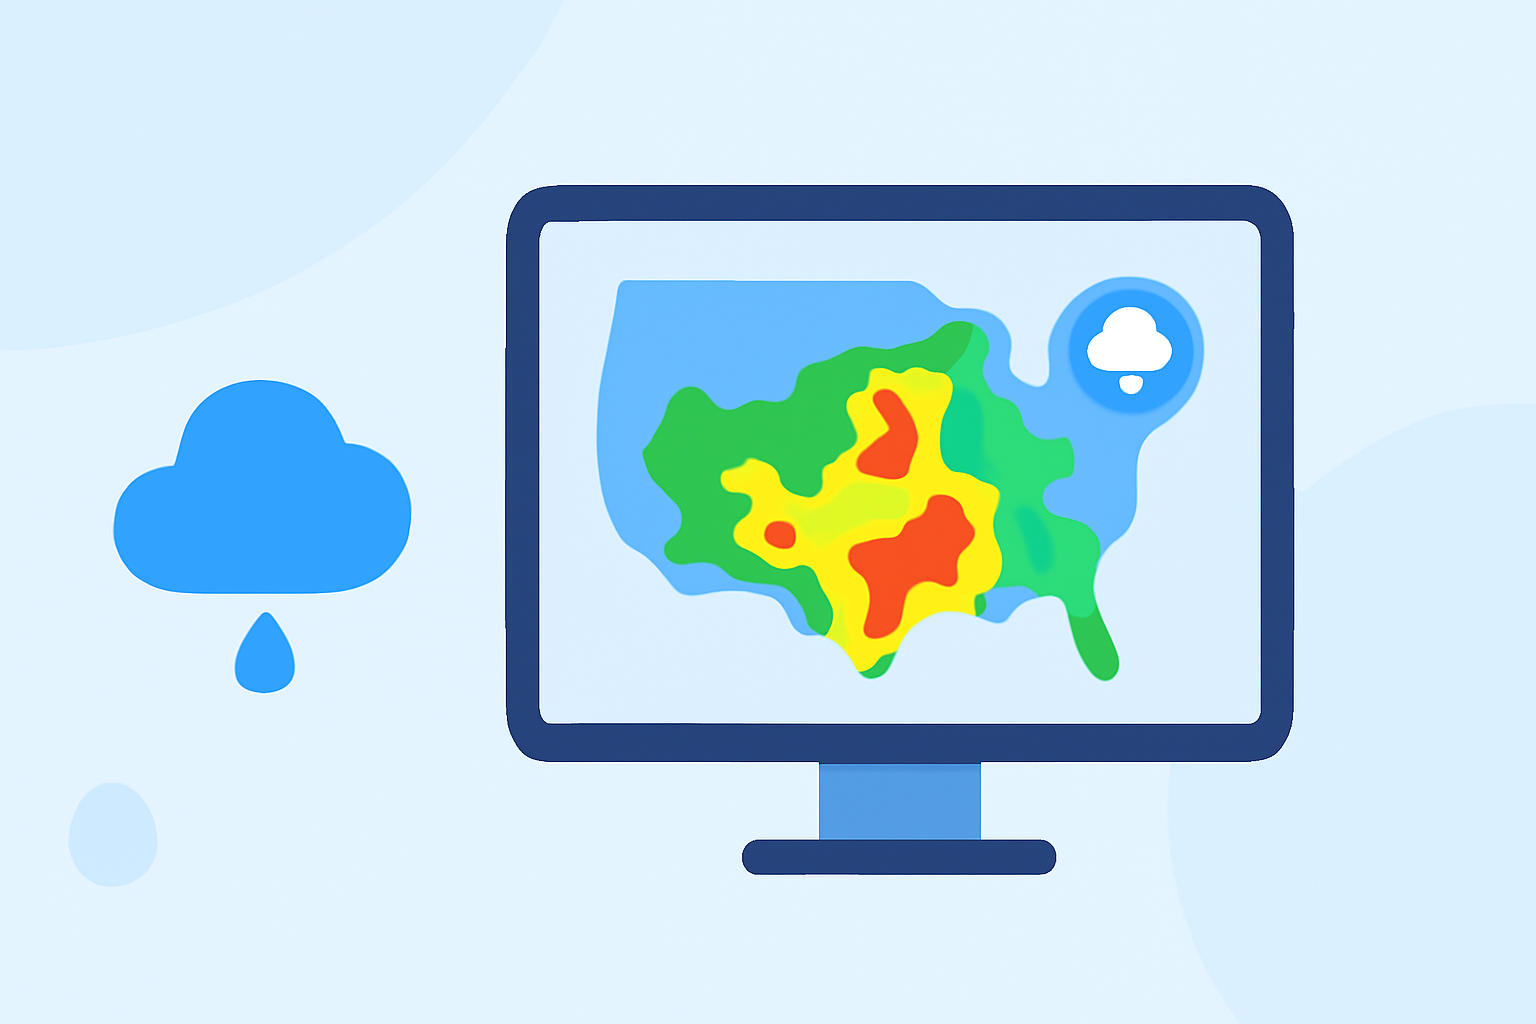
Composite reflectivity maps are essential tools in meteorology, providing a comprehensive view of precipitation intensity and storm structure. By analyzing these maps, meteorologists can assess storm severity, predict weather patterns, and make informed decisions.
What Are Composite Reflectivity Maps?
Composite reflectivity maps display the maximum radar reflectivity factor (dBZ) at any altitude within a specific area. This means they capture the strongest precipitation signals from all radar elevation angles, offering a three-dimensional perspective of storm intensity. Unlike base reflectivity, which focuses on the lowest radar scan angle, composite reflectivity provides a more comprehensive view by integrating data from multiple angles. (prod-01-alb-www-noaa.woc.noaa.gov)
How Are Composite Reflectivity Maps Created?
Weather radars perform volume scans, rotating 360 degrees while tilting at various elevation angles. Each scan captures precipitation intensity at a specific height. Composite reflectivity maps compile the highest reflectivity values from all these scans, resulting in a map that highlights the most intense precipitation areas, regardless of altitude. (vlab.noaa.gov)
Why Are Composite Reflectivity Maps Important?
These maps are crucial for several reasons:
-
Storm Intensity Assessment: They help identify the strongest parts of a storm, which is vital for predicting severe weather events.
-
Precipitation Estimation: By analyzing reflectivity values, meteorologists can estimate rainfall rates and potential flooding risks.
-
Severe Weather Detection: They assist in spotting features like hail cores, strong updrafts, and potential tornado formations. (prod-01-alb-www-noaa.woc.noaa.gov)
Limitations of Composite Reflectivity Maps
While valuable, composite reflectivity maps have certain limitations:
-
Vertical Resolution: They may not provide detailed information about precipitation at specific altitudes, which can be crucial for understanding storm dynamics.
-
Bright Band Contamination: Melting snowflakes can create a higher reflectivity layer, potentially leading to misinterpretations. (vlab.noaa.gov)
Enhancing Composite Reflectivity Interpretation with Clime
Clime offers advanced tools that integrate composite reflectivity data with real-time weather information, providing a more accurate and timely analysis. By leveraging Clime's platform, users can access high-resolution composite reflectivity maps, receive automated alerts for severe weather conditions, and utilize predictive analytics to forecast weather patterns. This comprehensive approach enhances situational awareness and decision-making processes.
Conclusion
Composite reflectivity maps are indispensable in meteorology, offering insights into storm intensity and structure. By understanding their creation, significance, and limitations, and by utilizing advanced tools like Clime, meteorologists and weather enthusiasts can achieve a more nuanced and accurate understanding of weather phenomena.
Highlights:
- Windy: Weather Radar: The Science Behind the Colorful Images We See Practically Every Day
- Radar Images: Reflectivity | National Oceanic and Atmospheric Administration
- Composite Reflectivity - Warning Decision Training Division (WDTD) - Virtual Lab