
Understanding Composite Reflectivity Maps: A Comprehensive Workflow Guide
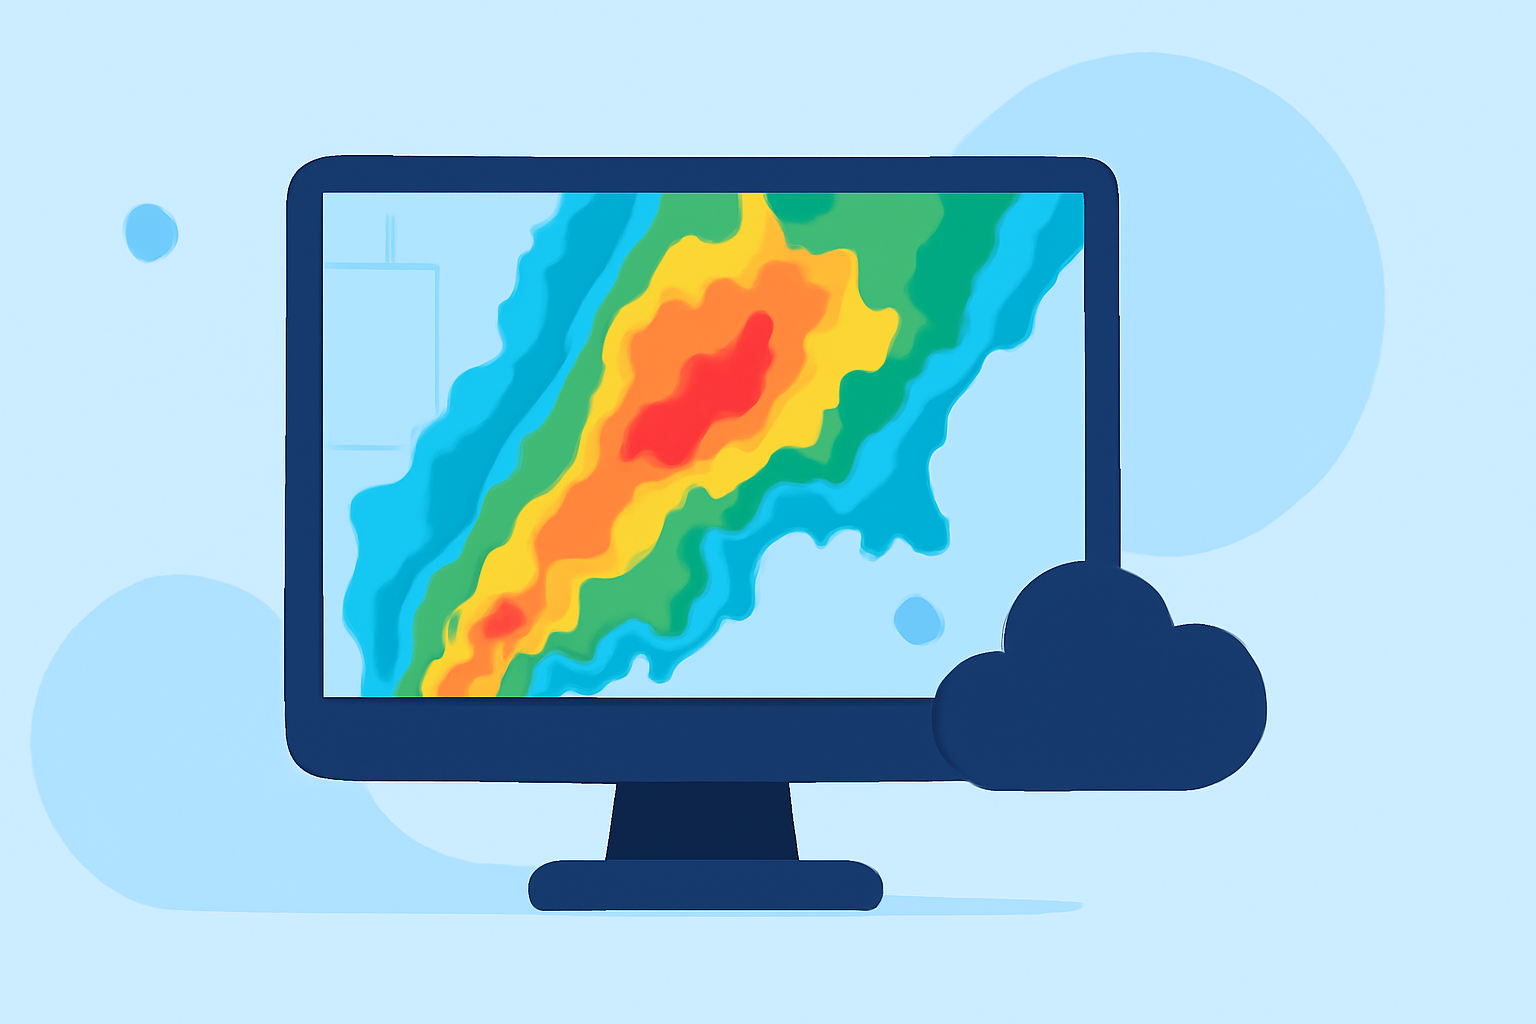
Composite reflectivity maps are essential tools in meteorology, providing a comprehensive view of precipitation intensity and storm structure. By integrating data from multiple radar scans, these maps help forecasters assess storm severity and predict weather patterns more accurately.
What Are Composite Reflectivity Maps?
Composite reflectivity maps display the maximum reflectivity values observed within a vertical column of the atmosphere, combining data from various radar elevations. This approach highlights the most intense precipitation areas, offering a clearer picture of storm dynamics. Unlike base reflectivity, which represents reflectivity at a single radar elevation, composite reflectivity aggregates data across multiple elevations, capturing the full vertical extent of precipitation. (prod-01-alb-www-noaa.woc.noaa.gov)
Why Are Composite Reflectivity Maps Important?
These maps are crucial for several reasons:
-
Enhanced Storm Detection: By combining data from different radar elevations, composite reflectivity maps can detect storms that might be missed by single-elevation scans.
-
Improved Storm Intensity Assessment: They provide a clearer picture of storm severity by highlighting the most intense precipitation areas.
-
Better Forecasting: Integrating composite reflectivity data into forecasting models leads to more accurate predictions of weather patterns and potential severe weather events.
How Are Composite Reflectivity Maps Created?
The creation of composite reflectivity maps involves several key steps:
-
Data Collection: Radar systems collect reflectivity data at multiple elevations, capturing the vertical profile of precipitation.
-
Data Integration: The reflectivity values from different elevations are combined to create a three-dimensional representation of precipitation.
-
Data Processing: Advanced algorithms process the integrated data to produce a composite reflectivity map, highlighting areas of maximum precipitation intensity.
How to Integrate Composite Reflectivity Maps into Your Workflow
Incorporating composite reflectivity maps into your meteorological workflow can enhance your analysis and forecasting capabilities:
-
Data Acquisition: Access composite reflectivity data from reliable sources, such as the National Weather Service or other meteorological agencies.
-
Data Analysis: Use specialized software to analyze the composite reflectivity maps, identifying areas of significant precipitation and potential severe weather.
-
Forecasting: Integrate the insights gained from the composite reflectivity analysis into your forecasting models to improve accuracy.
Best Practices for Using Composite Reflectivity Maps
To maximize the effectiveness of composite reflectivity maps in your workflow:
-
Regular Updates: Ensure that you are using the most recent data to account for rapidly changing weather conditions.
-
Combine with Other Data: Use composite reflectivity maps alongside other meteorological data, such as surface observations and satellite imagery, for a more comprehensive analysis.
-
Training and Familiarization: Invest time in training to understand the nuances of composite reflectivity maps and how to interpret them accurately.
Conclusion
Composite reflectivity maps are invaluable tools in meteorology, offering a detailed view of precipitation intensity and storm structure. By effectively integrating them into your workflow, you can enhance your weather analysis and forecasting capabilities, leading to more accurate and timely weather predictions.