
Understanding Doppler Shear Maps: A Comprehensive Guide
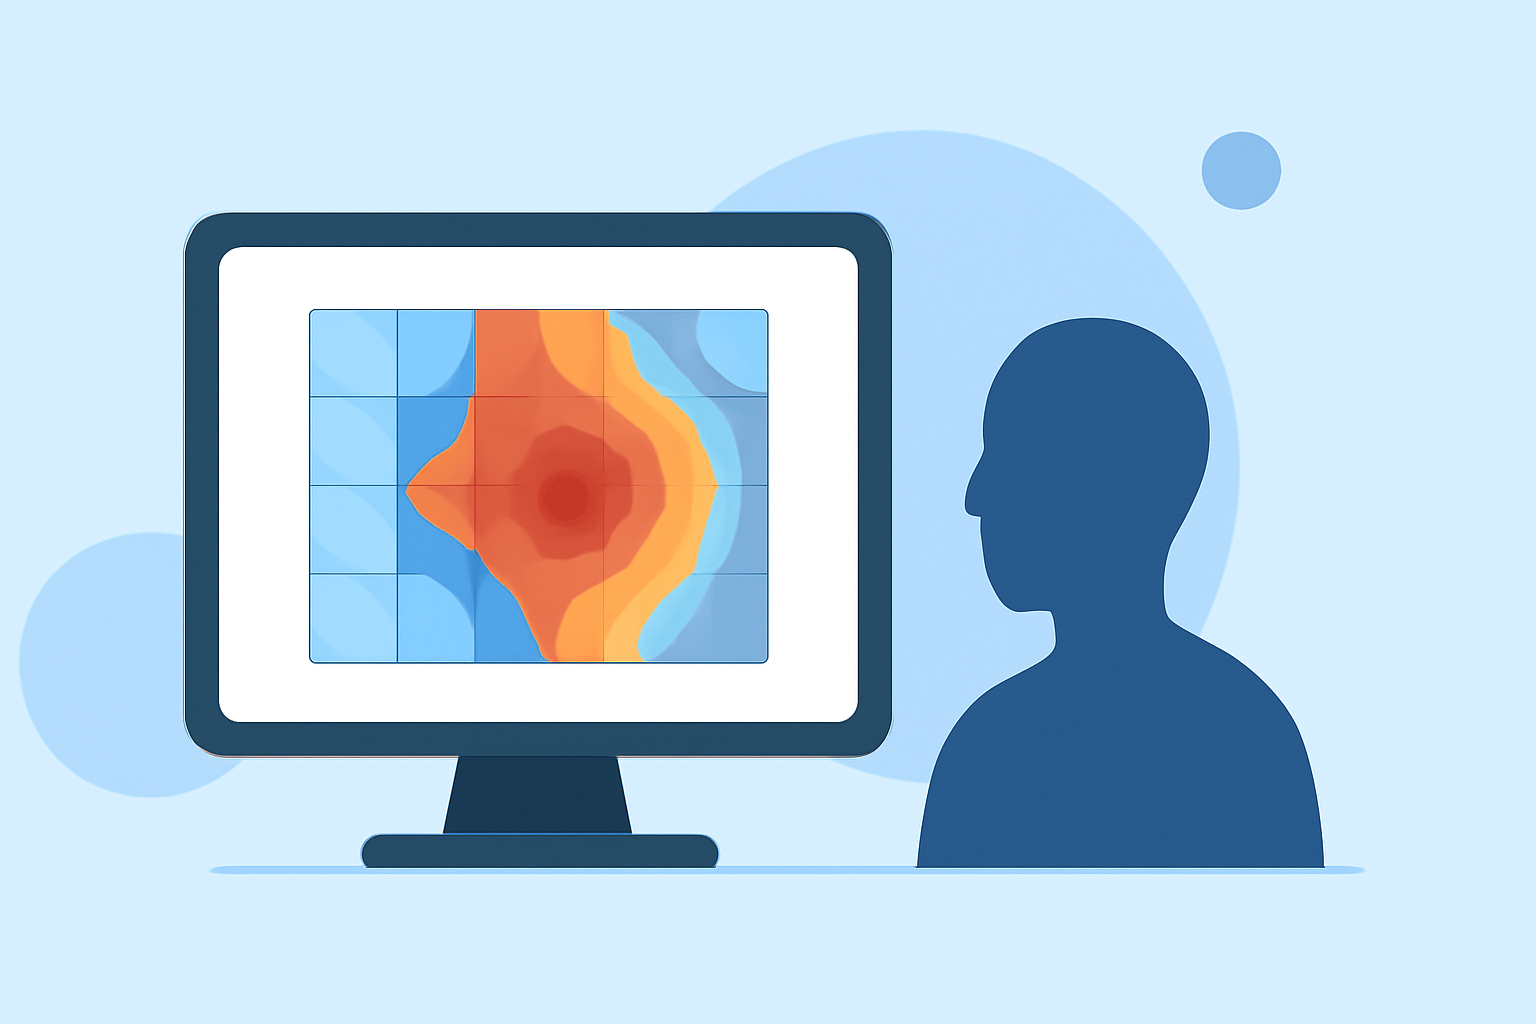
Doppler shear maps are vital tools in meteorology, enabling the analysis of wind patterns and the detection of severe weather phenomena. These maps utilize Doppler radar data to visualize wind shear—a change in wind speed and direction over a short distance—which is crucial for understanding storm dynamics and forecasting severe weather events.
What Are Doppler Shear Maps?
Doppler shear maps display variations in wind speed and direction within the atmosphere, derived from Doppler radar measurements. By analyzing these maps, meteorologists can identify areas of significant wind shear, which are often associated with severe weather conditions such as thunderstorms, tornadoes, and hurricanes.
How Are Doppler Shear Maps Created?
The creation of Doppler shear maps involves several key steps:
-
Data Collection: Doppler radar systems emit pulses of energy and measure the frequency shift (Doppler shift) of the returned signals to determine the velocity of precipitation particles.
-
Velocity Calculation: The radial velocity component is calculated by analyzing the Doppler shift, providing information on the speed and direction of particles moving toward or away from the radar.
-
Shear Calculation: Wind shear is computed by examining changes in wind velocity over a specific distance, often using algorithms that process radial velocity data to identify areas of significant shear.
-
Map Generation: The calculated shear values are then mapped spatially, creating visual representations that highlight regions of interest.
Interpreting Doppler Shear Maps
Interpreting Doppler shear maps requires understanding the following:
-
Color Coding: Typically, color gradients represent varying levels of wind shear, with warmer colors indicating higher shear values.
-
Contours and Isolines: Lines connecting points of equal shear values help identify areas of uniform shear and can indicate boundaries of different air masses.
-
Velocity Vectors: Arrows or vectors may be used to show wind direction and speed at specific locations.
By analyzing these elements, meteorologists can assess the potential for severe weather development and make informed forecasting decisions.
Applications of Doppler Shear Maps
Doppler shear maps are instrumental in various meteorological applications:
-
Severe Weather Detection: Identifying areas of strong wind shear is crucial for detecting and monitoring severe weather events like tornadoes and thunderstorms.
-
Flight Safety: Pilots use shear maps to anticipate and avoid hazardous wind conditions during flight.
-
Storm Prediction: Understanding wind shear patterns aids in predicting storm development and movement.
Limitations and Considerations
While Doppler shear maps are powerful tools, they have limitations:
-
Data Resolution: The accuracy of shear maps depends on the resolution of radar data; higher resolution provides more detailed information.
-
Radar Coverage: Areas with limited radar coverage may result in incomplete shear maps.
-
Interpretation Complexity: Accurate interpretation requires expertise, as shear maps can be complex and influenced by various atmospheric factors.
Advancements in Doppler Shear Mapping
Advancements in radar technology and data processing have enhanced the capabilities of Doppler shear maps:
-
Higher Resolution Data: Modern radars provide higher resolution data, improving the detection of fine-scale wind shear features.
-
Real-Time Processing: Advances in computing allow for real-time processing of radar data, enabling timely updates to shear maps.
-
Integration with Other Data Sources: Combining shear maps with other meteorological data sources, such as satellite imagery and surface observations, provides a more comprehensive understanding of atmospheric conditions.
Understanding and effectively utilizing Doppler shear maps is essential for meteorologists in forecasting severe weather and ensuring public safety.