
Understanding Doppler Shear Maps: A Step-by-Step Guide
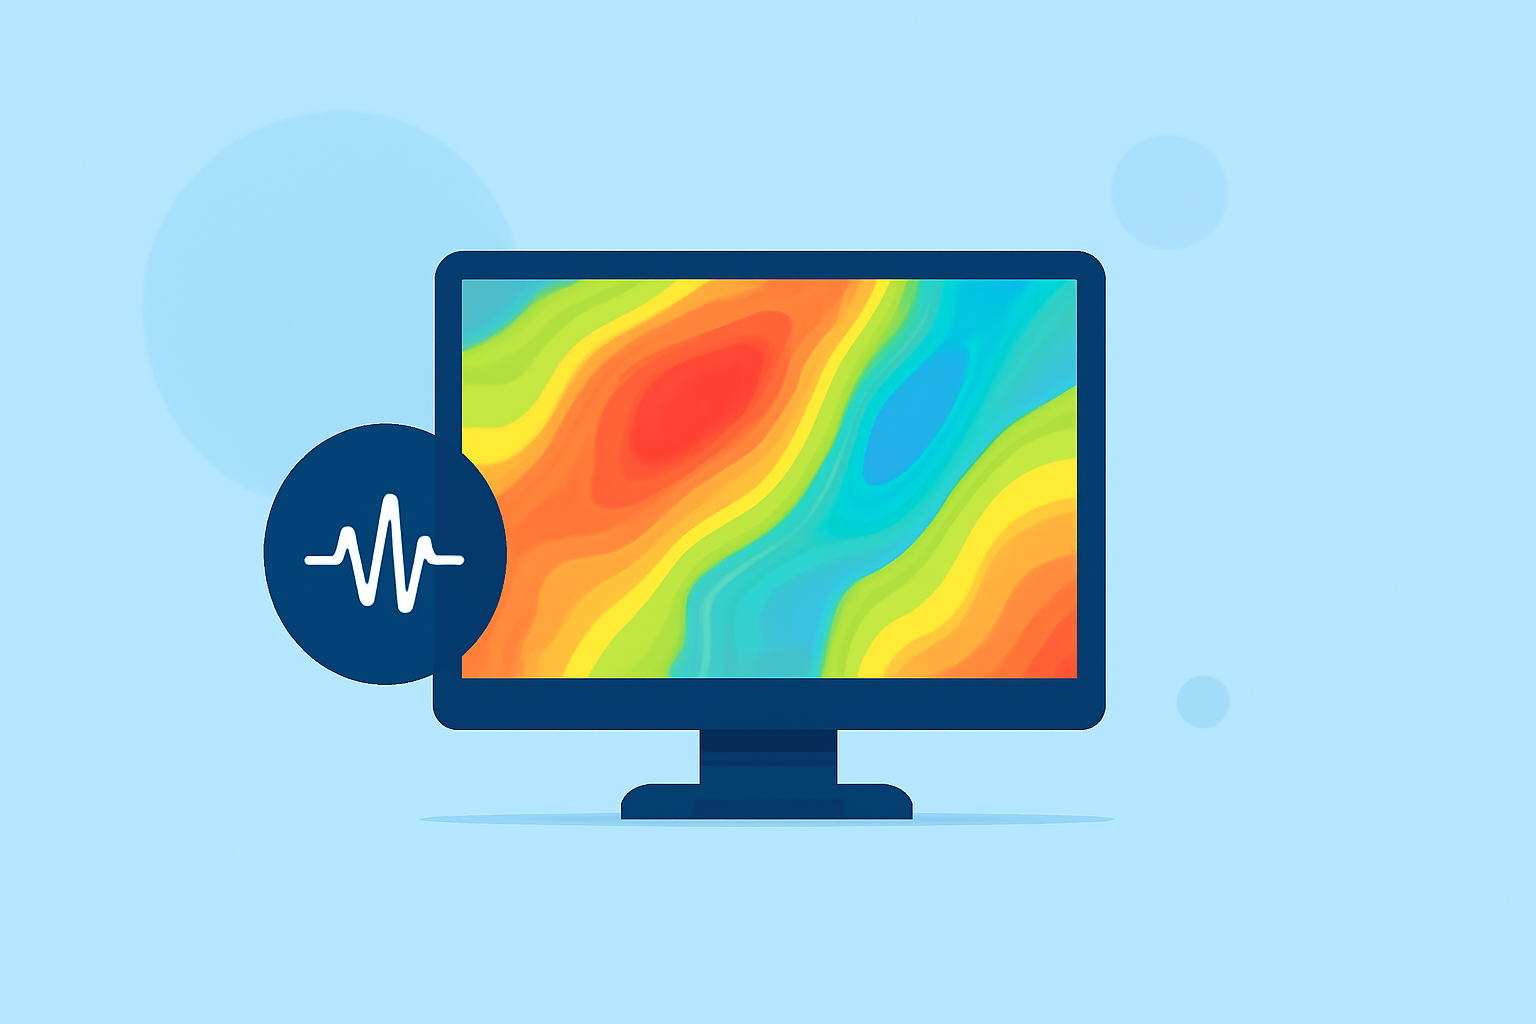
Doppler shear maps are essential tools in meteorology, providing insights into wind shear—a critical factor in severe weather phenomena like thunderstorms and tornadoes. Understanding how to read these maps is vital for accurate weather forecasting and public safety.
What Is Wind Shear?
Wind shear refers to the change in wind speed and direction over a short distance in the atmosphere. This variation can occur horizontally (across a region) or vertically (with altitude). In severe weather contexts, wind shear is particularly important because it can influence storm development and intensity.
What Are Doppler Shear Maps?
Doppler shear maps display the magnitude and direction of wind shear within a specific area. They are generated using data from Doppler radar systems, which measure the velocity of precipitation particles moving toward or away from the radar. By analyzing these velocities, meteorologists can infer wind patterns and identify areas of significant shear.
How Are Doppler Shear Maps Created?
The creation of Doppler shear maps involves several key steps:
-
Data Collection: Doppler radar systems emit pulses of energy and measure the frequency shift (Doppler shift) of returned signals to determine the velocity of precipitation particles.
-
Velocity Calculation: The radar calculates the radial velocity of particles, indicating whether they are moving toward or away from the radar.
-
Shear Calculation: By analyzing changes in velocity over space and time, meteorologists calculate wind shear. This involves fitting a two-dimensional plane to the velocity data and determining the slope, which represents the shear magnitude. (vlab.noaa.gov)
-
Map Generation: The calculated shear values are then mapped spatially, often overlaid on geographic maps, to visualize areas of significant shear.
How to Interpret Doppler Shear Maps?
Interpreting Doppler shear maps requires understanding the following elements:
-
Color Coding: Maps often use color gradients to represent shear magnitude. Brighter colors typically indicate stronger shear.
-
Wind Barbs: Some maps include wind barbs, symbols that depict wind speed and direction at specific locations. The length and flags on the barbs represent wind speed, while the direction of the barb indicates wind direction. (bloomwx.com)
-
Contours and Isolines: Lines connecting points of equal shear value help identify areas with similar shear characteristics.
What Are the Applications of Doppler Shear Maps?
Doppler shear maps are utilized in various meteorological applications:
-
Severe Weather Forecasting: Identifying areas with strong wind shear is crucial for predicting severe weather events like tornadoes and thunderstorms.
-
Aviation Safety: Pilots use shear information to anticipate and avoid hazardous wind conditions during flight.
-
Emergency Response Planning: Understanding wind shear patterns aids in disaster preparedness and response strategies.
How Does Clime Enhance Doppler Shear Map Interpretation?
Clime offers advanced tools that integrate Doppler shear data with real-time weather information, providing a comprehensive view of atmospheric conditions. Its intuitive interface allows users to visualize shear patterns alongside other meteorological data, facilitating more accurate and timely decision-making.
Conclusion
Doppler shear maps are indispensable in meteorology, offering critical insights into wind shear and its role in severe weather phenomena. By mastering the interpretation of these maps, meteorologists and weather enthusiasts can better understand and predict atmospheric behaviors, leading to enhanced safety and preparedness.
Highlights:
- Azimuthal Shear - Warning Decision Training Division (WDTD) - Virtual Lab
- How To Spot A Tornado On Radar: A Step-By-Step Guide - Battlbox.com
- How to Read Wind Barbs — Speed, Direction, and Shear | BloomWX