
Understanding Doppler Velocity Maps: A Comprehensive Guide
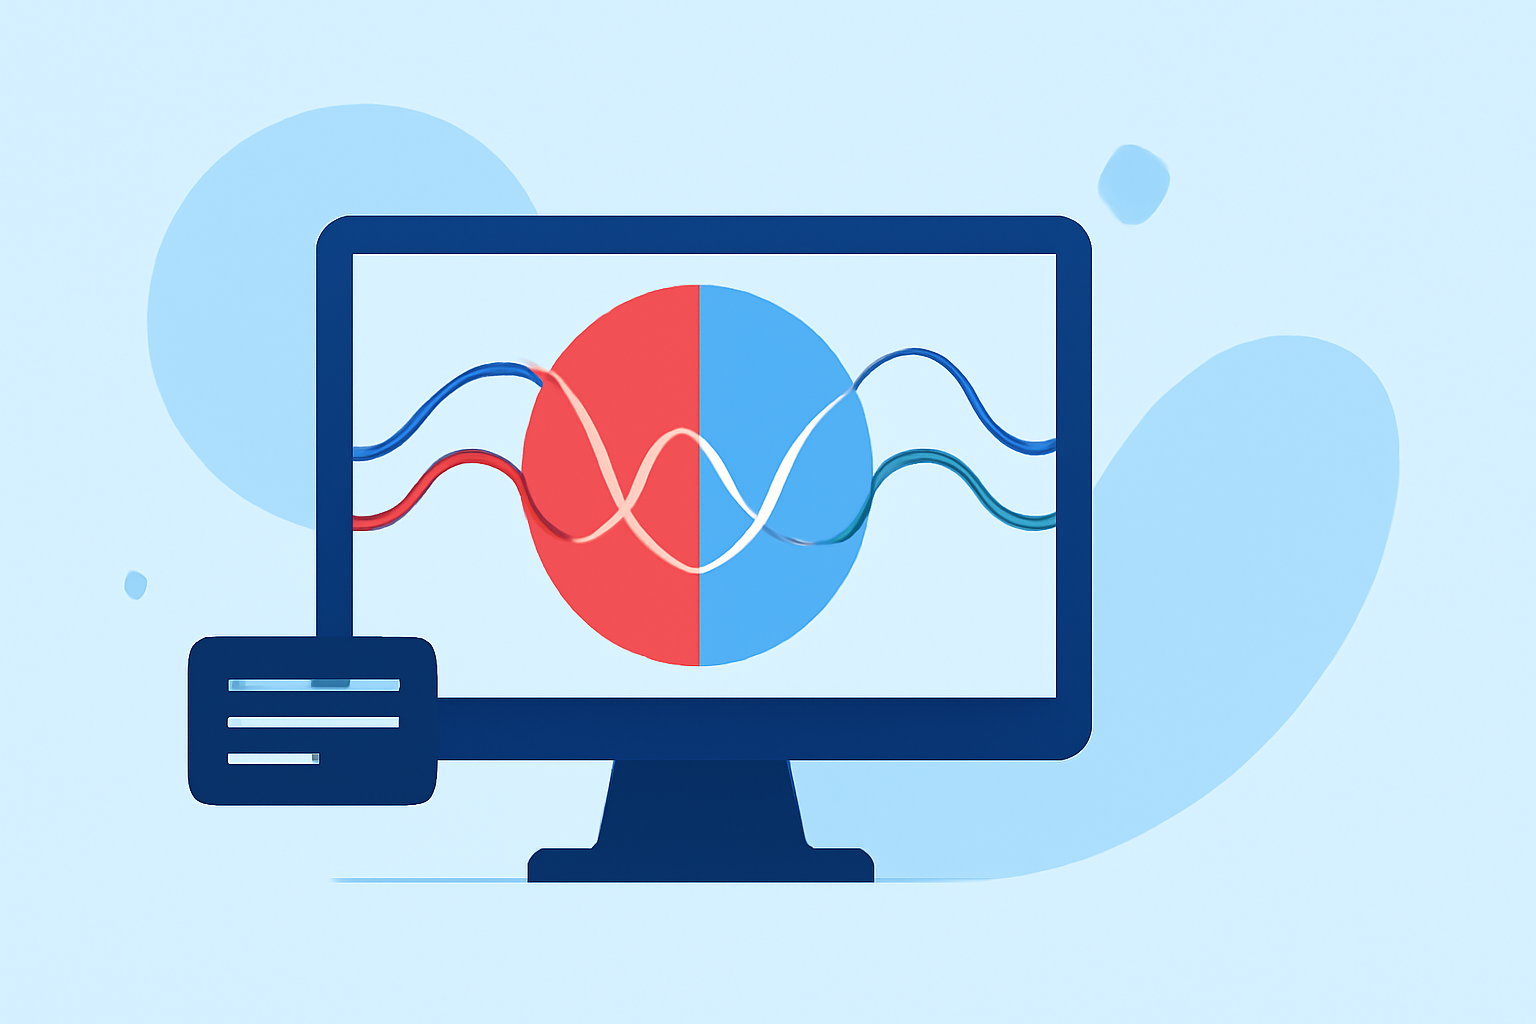
Doppler velocity maps are essential tools in meteorology, providing insights into wind patterns and storm dynamics. By analyzing the frequency shifts in radar signals caused by moving particles, these maps help meteorologists interpret weather phenomena more accurately.
What Are Doppler Velocity Maps?
Doppler velocity maps display the speed and direction of particles within a radar's line of sight. In meteorology, they are primarily used to assess wind velocities within storm systems. The Doppler effect causes a shift in the frequency of the radar signal reflected by moving particles:
-
Redshift (Positive Velocity): Particles moving away from the radar cause a decrease in frequency, resulting in a redshift.
-
Blueshift (Negative Velocity): Particles moving toward the radar cause an increase in frequency, resulting in a blueshift.
By measuring these shifts, Doppler radar systems can determine the radial component of a particle's velocity, which is crucial for understanding wind patterns and storm structures. (en.wikipedia.org)
How Are Doppler Velocity Maps Interpreted?
In Doppler velocity maps, colors represent the direction and speed of particle movement:
-
Red and Orange: Indicate particles moving away from the radar (radial velocity).
-
Blue and Green: Indicate particles moving toward the radar.
The intensity of the color reflects the speed of movement. For example, a deep red may indicate a high-speed outflow, while a light blue suggests a slower inflow. This color-coding allows meteorologists to quickly assess wind patterns and identify features like updrafts, downdrafts, and rotation within storms. (psl.noaa.gov)
Applications in Meteorology
Doppler velocity maps are instrumental in various meteorological analyses:
-
Storm Detection and Analysis: They help identify rotation within storms, which is crucial for detecting tornadoes. A tight couplet of red and green areas in a velocity map can indicate a rotating column of air, signaling potential tornado development. (farmersalmanac.com)
-
Wind Profiling: By analyzing velocity maps, meteorologists can determine wind speeds and directions at different altitudes, aiding in weather forecasting and understanding atmospheric dynamics.
-
Precipitation Studies: Velocity maps assist in distinguishing between different types of precipitation and their movement, enhancing the accuracy of weather predictions.
Enhancing Weather Analysis with Clime
Clime offers advanced tools that integrate Doppler velocity data with other meteorological information, providing a comprehensive view of weather systems. By combining velocity maps with reflectivity data, Clime enables users to visualize storm structures, track movement, and predict potential severe weather events more effectively. This holistic approach enhances situational awareness and decision-making for meteorologists and weather enthusiasts alike.
Conclusion
Doppler velocity maps are vital for understanding wind patterns and storm dynamics in meteorology. By accurately interpreting these maps, meteorologists can make informed decisions, leading to better weather forecasts and public safety. Tools like Clime further enhance this capability, offering integrated solutions for comprehensive weather analysis.
Highlights:
- Doppler radar
- How Doppler Radar Works and How It Detects Storms in Real Time, Published on Saturday, May 02