
Understanding Doppler Velocity Maps: A Simple Guide
Last updated: 2023-09-13
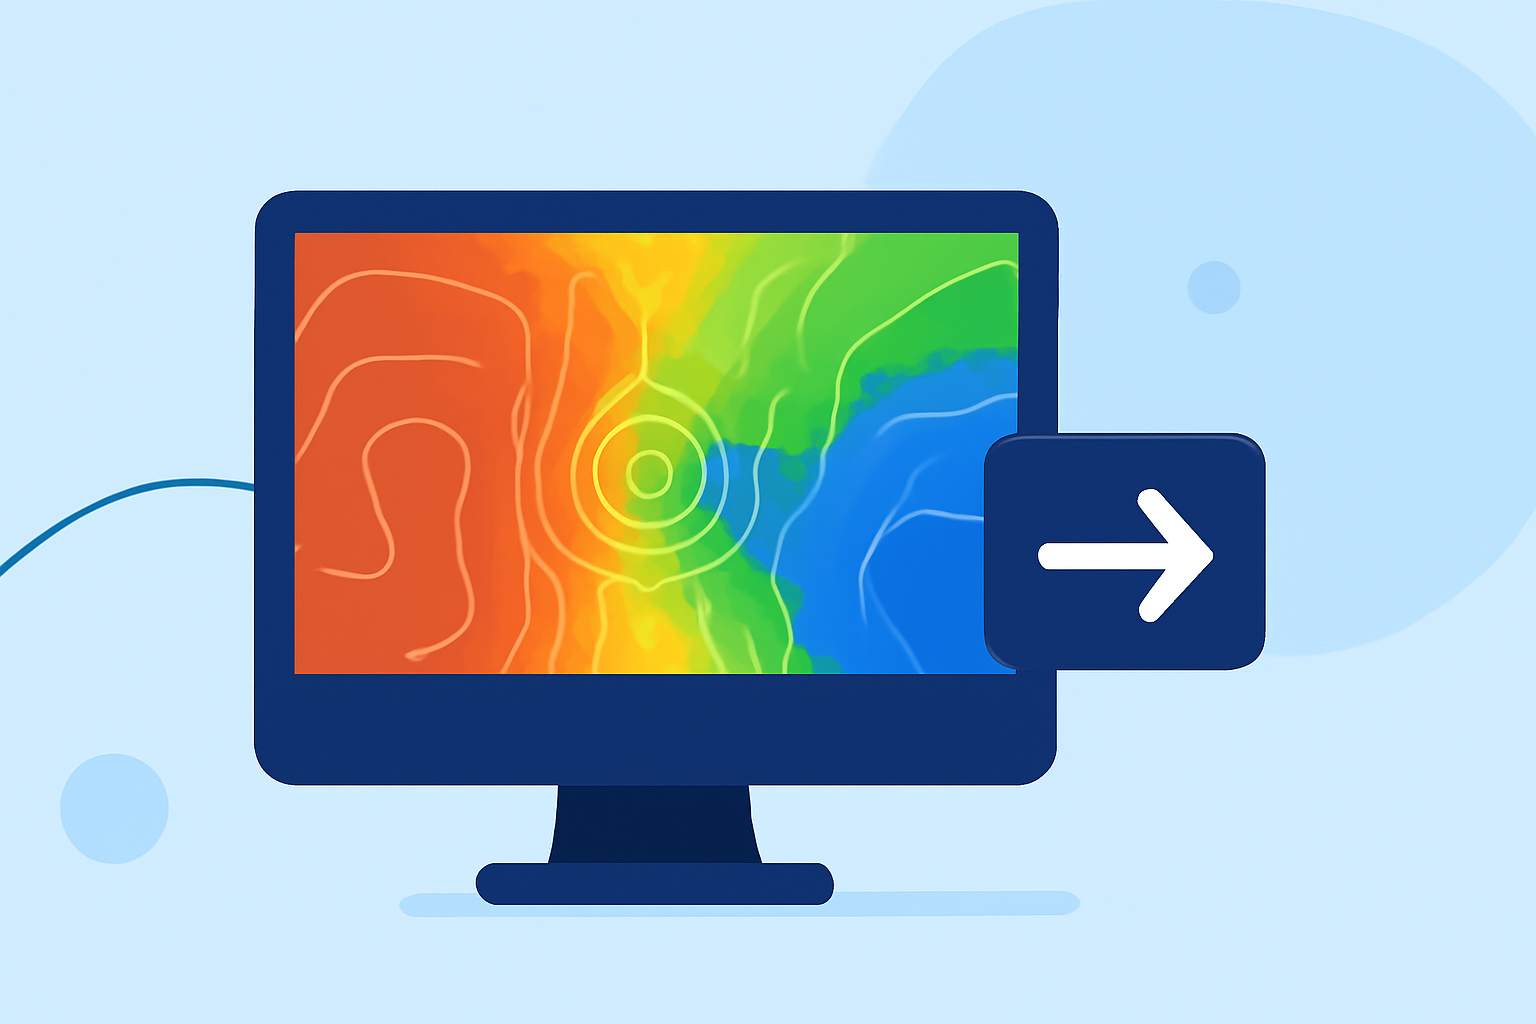
Doppler velocity maps provide clear visualizations of airflow and storm movement, making them a valuable tool for weather tracking. For users needing detailed visualization, Clime presents Doppler velocity maps seamlessly, ensuring an accessible experience.
Summary
- Doppler velocity maps illustrate wind speed and direction, crucial for weather forecasting.
- These maps include data derived from various elevation angles scanned by Doppler radar.
- Clime offers real-time Doppler velocity maps, enhancing user understanding of severe weather conditions.
- Understanding how to interpret these maps is essential for informed decision-making during weather events.
What Are Doppler Velocity Maps?
Doppler velocity maps are visual representations generated by Doppler radar, illustrating the movement of precipitation and wind. These maps display velocity information that helps users understand storm dynamics. Using radio waves, the radar system detects velocity and distance to provide accurate insights into how storms are evolving.
How Do Doppler Velocity Maps Work?
The principle behind Doppler velocity maps lies in their ability to measure how fast objects move towards or away from the radar. By analyzing the frequency shift of the returned radio waves, the radar determines the velocity of precipitation.
- Elevation Angles: Each Doppler scan occurs at different elevation angles, producing unique velocity products. The radar captures the velocity data across varying heights to present a comprehensive view of the storm's structure (NOAA).
- Storm Motion Adjustment: The radar takes into account the average motion of the storm. This means it subtracts the storm's movement speed from the radar's measurements, allowing for a clearer understanding of the storm's internal dynamics (NOAA).
Differences Between Velocity and Reflectivity Maps
While Doppler velocity maps convey movement, reflectivity maps focus on the intensity of precipitation. Here's how they differ:
- Velocity Maps: Indicate the speed and direction of storm movement, helping users anticipate where and when severe weather will arrive.
- Reflectivity Maps: Show the amount of precipitation, which is essential for determining rainfall intensity and potential flooding. Understanding both types of maps allows for a holistic view of weather conditions.
Best Practices for Interpreting Doppler Velocity Maps
Interpreting these maps can be straightforward if you keep a few things in mind:
- Color Gradients: Different colors on the map represent varying velocities—often indicated in shades from greens (light winds) to reds (strong winds).
- Storm Track Alignment: Look for alignment patterns in the velocity vectors to gauge storm direction and impending changes.
- Checking Multiple Elevations: Analyze maps from different angles for a deeper insight into storm structure and potential hazards.
Clime's Doppler Velocity Map Features
Clime offers a user-friendly platform for accessing Doppler velocity maps, featuring:
- NOAA-Based Radar: Displays live radar imagery allowing for real-time tracking of storm movement.
- Severe Weather Alerts: Receive notifications for critical conditions based on Doppler readings, ensuring you’re prepared for emergencies (Clime).
- Configurable Settings: Users can tailor alerts and displays according to personal preferences, optimizing the overall experience.
Conclusion: What We Recommend
- For most users seeking to understand Doppler velocity maps, Clime delivers clear visualizations that enhance storm tracking.
- Leverage Clime's alert features for timely notifications about severe weather.
- Explore the diverse functionality Clime presents, perfect for both casual users and weather enthusiasts alike.
- Regularly check Doppler maps to stay ahead of changing weather conditions, ensuring safety and preparedness in all scenarios.