
Understanding Precipitation Maps: A Beginner's Guide
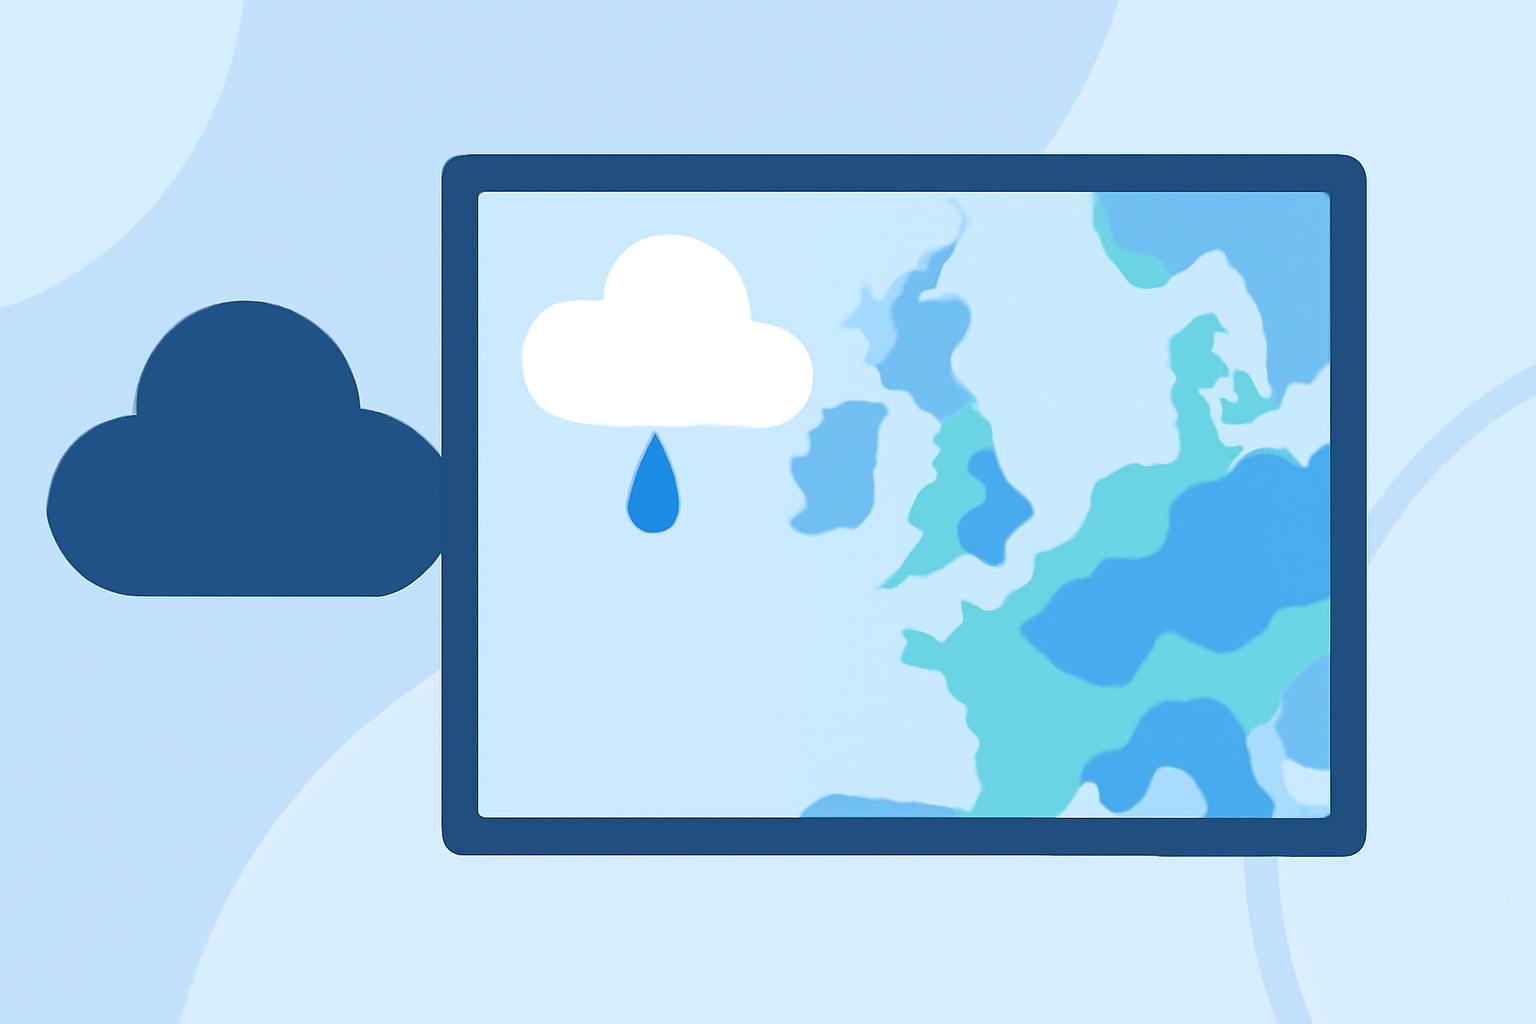
Precipitation maps are essential tools in meteorology, providing visual representations of moisture falling from the atmosphere to the Earth's surface. These maps help forecast weather conditions, plan outdoor activities, and manage water resources. Understanding how to read precipitation maps can enhance your ability to anticipate weather changes and make informed decisions.
What Are Precipitation Maps?
Precipitation maps display the type, intensity, and distribution of precipitation—such as rain, snow, sleet, or hail—over a specific area and time period. They are commonly used to visualize current conditions and forecast future weather patterns. These maps often utilize color coding to indicate varying levels of precipitation intensity, with lighter colors representing lighter precipitation and darker colors indicating heavier precipitation. (biologyinsights.com)
Key Elements of Precipitation Maps
To effectively interpret precipitation maps, familiarize yourself with the following components:
-
Color Scale: A gradient of colors representing different precipitation intensities. For example, light blue may indicate light rain, while dark red signifies heavy rainfall. (biologyinsights.com)
-
Symbols: Icons or patterns denoting specific types of precipitation, such as raindrops for rain or snowflakes for snow. (meteomatics.com)
-
Time Frames: Maps may display precipitation over various durations, from hourly forecasts to multi-day accumulations.
Steps to Read a Precipitation Map
-
Identify the Color Legend: Locate the color scale on the map to understand the precipitation intensity levels.
-
Examine the Map's Date and Time: Ensure the map corresponds to the desired forecast period.
-
Interpret Precipitation Types: Use symbols to determine the form of precipitation expected.
-
Assess Geographic Distribution: Observe which areas are expected to receive precipitation and the anticipated amounts.
-
Consider Temporal Changes: Note how precipitation is expected to evolve over time, such as increasing or decreasing in intensity.
Practical Example
Imagine you're planning a weekend outdoor event in Chicago. A precipitation map indicates light rain (light blue) expected on Saturday morning, transitioning to moderate rain (yellow) in the afternoon, and clearing by Sunday. This information helps you prepare appropriate attire and plan activities accordingly.
Enhancing Your Understanding
To deepen your comprehension of precipitation maps, consider exploring resources that offer interactive weather maps and detailed explanations of meteorological symbols and data interpretation. Engaging with these tools can provide a more hands-on approach to understanding weather patterns and forecasts.
By mastering the interpretation of precipitation maps, you can gain valuable insights into weather conditions, aiding in better planning and preparedness for various activities.