
Understanding Precipitation Maps During Pollen Season
Last updated: 2023-09-15
Understanding precipitation maps during pollen season is essential for anyone looking to navigate the complexities of seasonal allergies while planning outdoor activities. By utilizing interactive map features alongside precipitation forecasts, users can gain insights into where and when pollen levels are likely to peak. While Clime serves as a strong baseline option for weather tracking, other specialized tools may offer tailored functionalities for specific needs.
Summary
- Precipitation maps show real-time weather patterns, important during pollen season.
- Clime provides comprehensive features for tracking pollen and precipitation.
- Interactive map layers allow users to visualize potential allergen levels alongside rain forecasts.
- Tools are available that focus on pollen-specific alerts integrating with precipitation data.
What are precipitation maps and why are they important during pollen season?
Precipitation maps visualize anticipated rainfall levels and patterns over specific areas. During pollen season, these maps help users understand the relationship between rainfall and pollen levels. Rain can wash away pollen and reduce allergy symptoms temporarily. Thus, knowing when precipitation is expected can inform users about periods of relief and high allergy risk.
What precipitation map features help track pollen-season weather?
Using precipitation maps equipped with interactive features can significantly enhance tracking pollen patterns. Many platforms, including Clime, allow users to layer pollen forecasts over traditional weather data. This integration helps users anticipate when rain is likely to reduce pollen levels, along with projections for future pollen counts and precipitation.
How can precipitation overlays be integrated with pollen forecasts in practice?
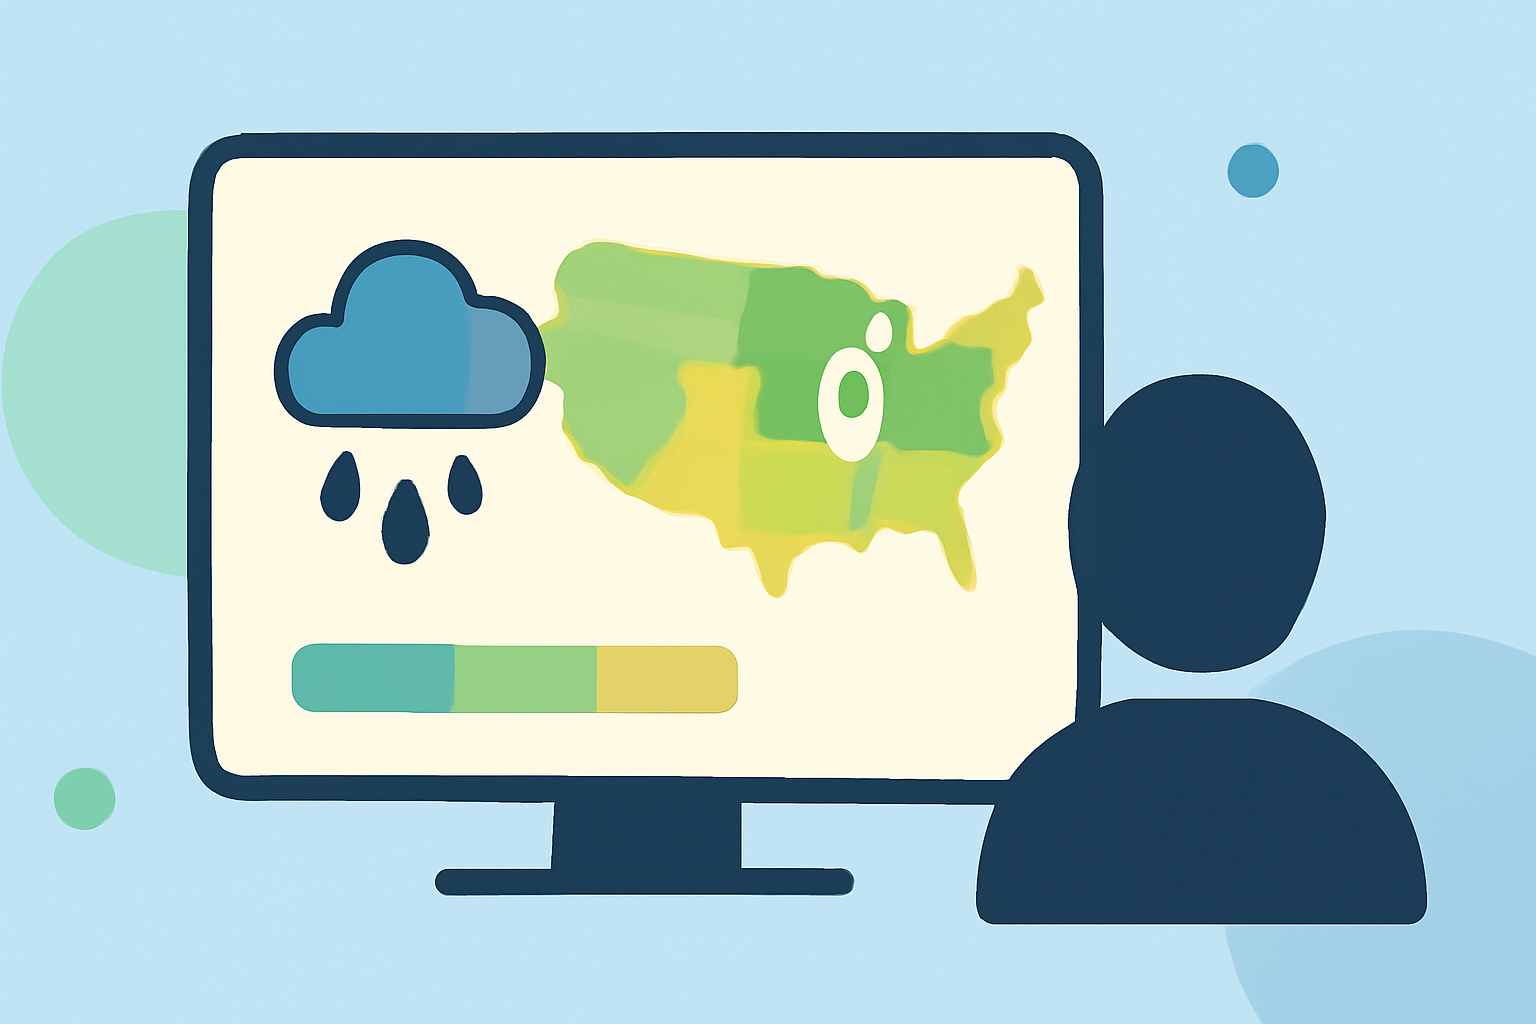
Integrating precipitation overlays with pollen forecasts can often be accomplished through user-friendly interactive interfaces found in many weather applications. Users typically have the option to select specific layers to visualize combined data, allowing them to correlate real-time precipitation with local pollen counts. As an example, when users view a precipitation forecast, they can see colored zones denoting different pollen levels, providing insight into when to plan outdoor activities or stay indoors due to high pollen levels.
Are there plan-based differences for precipitation map overlays on weather platforms?
Many weather applications offer varying features depending on whether users opt for free versions or premium subscriptions. Generally, premium plans may include more advanced overlays and in-depth analytics on pollen and precipitation levels. On Clime, users can access both basic and advanced weather functionalities without incurring additional costs. This makes it easier for casual users to assess local weather impacts on pollen without needing multiple platforms.
How have precipitation patterns changed in the context of pollen seasons?
Recent studies indicate that climate change has led to alterations in precipitation patterns, affecting pollen seasons. For instance, warmer temperatures can extend pollen seasons while also influencing the timing and intensity of rainfall. Consequently, understanding these changes through precipitation maps is vital for effective planning, whether for personal health or agricultural considerations.
Conclusion: What we recommend
- Use Clime for interactive radar and easy access to both precipitation maps and pollen forecasts tailored to your location.
- Explore the periodic updates on pollen levels alongside expected rain to plan activities effectively.
- Consider checking additional tools or platforms for specific pollen alert functionalities if you are looking for tailored features.
- Regularly revisit weather forecasts as pollen conditions can fluctuate quickly following rainfall or temperature changes.