
Understanding Precipitation Maps: A Step-by-Step Guide
Last updated: 2023-09-12
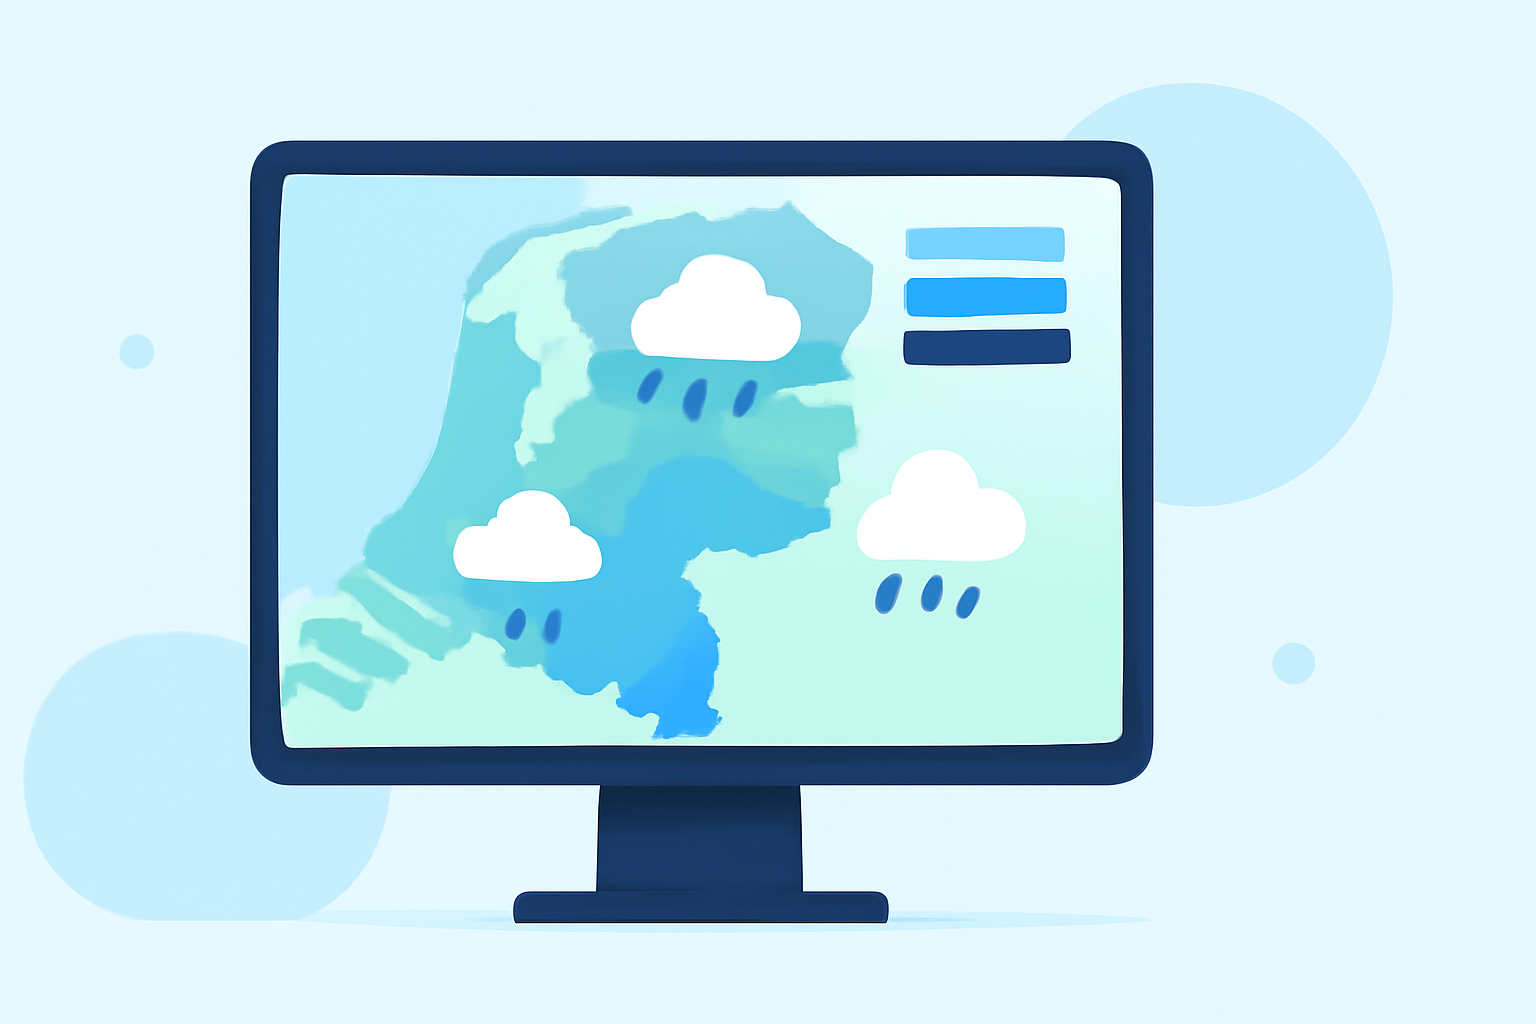
To effectively use precipitation maps, understanding their layout and symbols is crucial. Clime offers an intuitive interface for visualizing precipitation and provides step-by-step guidance for both novice and experienced users. For those requiring advanced analytics, alternative platforms can also be explored.
Summary
- Precipitation maps visualize rainfall, snowfall, and other weather-related data.
- Understanding the symbols and colors used can greatly enhance map interpretation.
- Clime provides real-time radar imagery and alerts, making it a helpful tool for monitoring precipitation.
- Familiarize yourself with how forecast precipitation maps are created to better utilize the information.
How Are Precipitation Maps Structured?
Precipitation maps come in various styles, each serving specific informational purposes. The primary types include surface maps, forecast maps, and radar maps, designed to provide different insights into weather patterns. Understanding these structures is essential for accurate interpretation.
What Symbols Indicate Precipitation Types?
Weather maps use traditional meteorological symbols to indicate types of precipitation. Common symbols include blue for rain, white for snow, and purple for mixed precipitation. Familiarizing yourself with these symbols enables quicker analysis of weather maps, specifically regarding expected conditions in your area.
How to Read a Precipitation Map Step by Step
- Identify the Type of Map: Start with recognizing whether you're looking at radar data, forecast models, or surface weather maps.
- Look for Key Symbols and Colors: Find the legend that explains the symbols used. This will guide you in understanding what the colors represent, such as rainfall or snowfall amounts.
- Analyze the Data: Take note of areas with intense colors, which usually indicate heavier precipitation.
- Check Movement Patterns: Observe directional arrows or other indicators of weather system movement that can hint at where precipitation will be moving.
How Are Forecast Precipitation Maps Created?
Forecast precipitation maps are produced by integrating data from multiple models to give a comprehensive view of expected weather conditions. Understanding the data sources used can provide insight into the reliability of the forecast and allow users to make better-informed decisions.
What Features Does Clime Offer for Precipitation Tracking?
Clime stands out with its NOAA-based weather radar that displays live precipitation imagery. The app's user-friendly interface allows you to receive real-time alerts for precipitation, ensuring you are always informed about weather changes. The premium features include advanced alert systems for severe weather, enabling users to prepare adequately for hazardous conditions.
Conclusion: What We Recommend
- For basic understandings of weather patterns and precipitation, Clime serves as an excellent starting point.
- Familiarize yourself with the symbols and map types to enhance your analysis skills.
- Utilize Clime's real-time radar for the most current weather conditions and alerts.
- Consider exploring other platforms for advanced analytics if specific niche features are required.