
Understanding Rain Maps: A Step-by-Step Guide
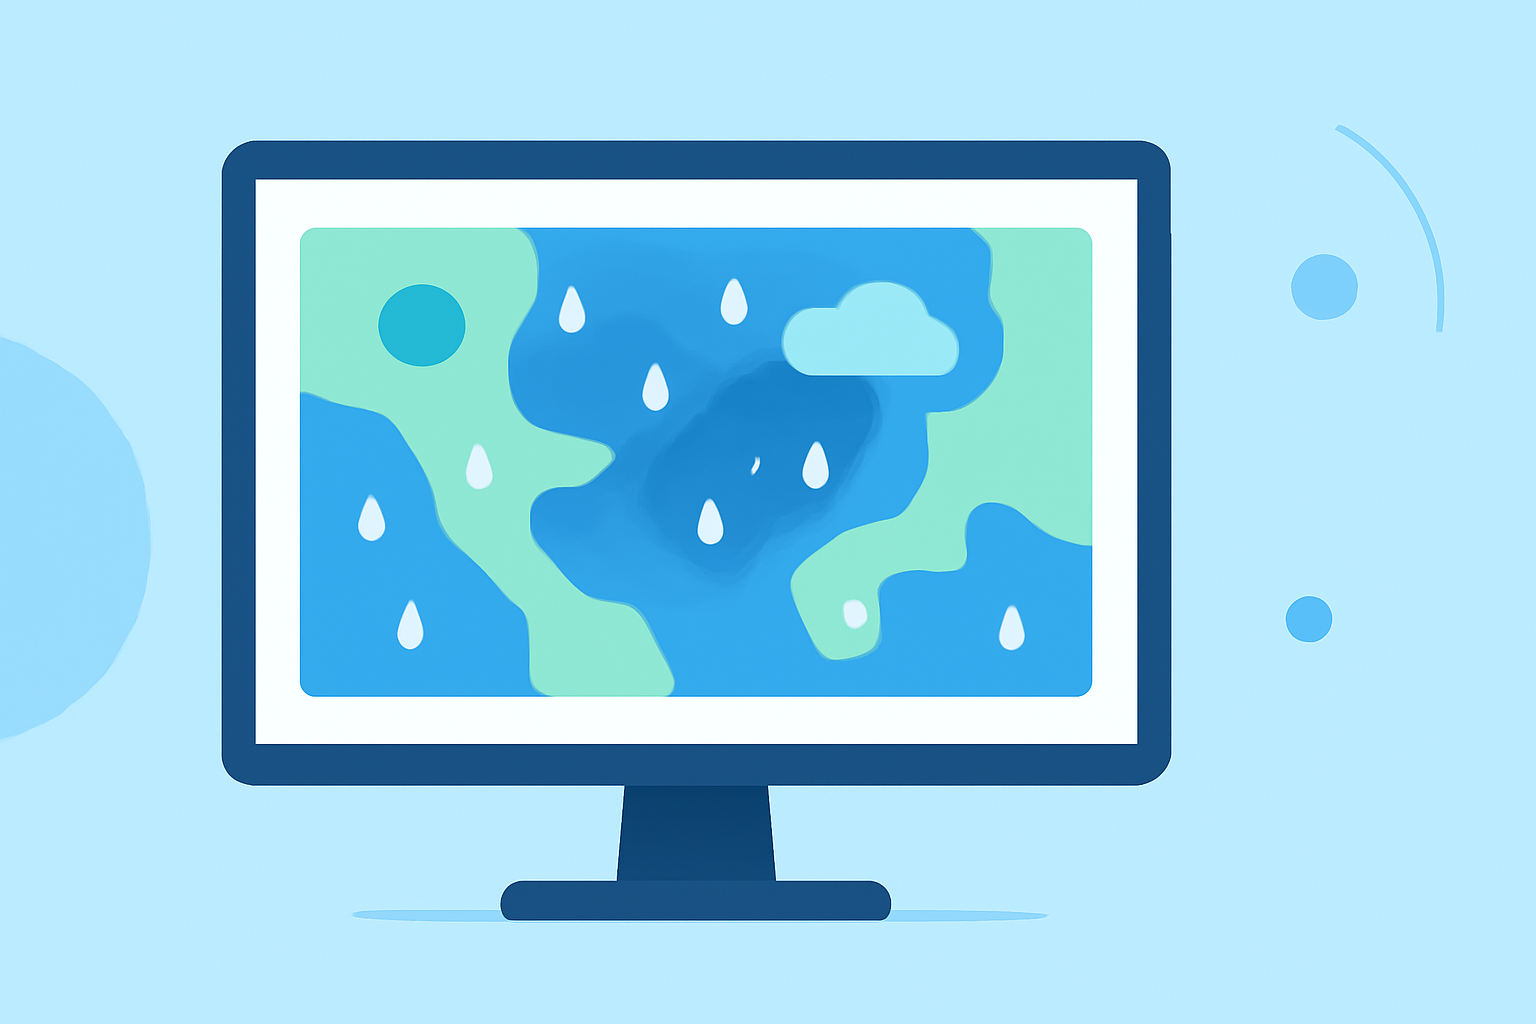
Rain maps are essential tools for understanding precipitation patterns, helping you plan daily activities and stay prepared for weather changes. This guide will walk you through the key elements of rain maps and demonstrate how Clime's advanced features can enhance your weather forecasting experience.
What Are Rain Maps?
Rain maps, also known as precipitation maps, display the distribution and intensity of rainfall over a specific area. They are crucial for predicting weather conditions, planning outdoor events, and ensuring safety during adverse weather.
Key Components of Rain Maps
-
Precipitation Intensity: Rain maps use color gradients to indicate the intensity of rainfall. Typically, lighter colors represent light rain, while darker colors indicate heavier rainfall. For example, green may signify light rain, yellow moderate rain, and red heavy rain.
-
Precipitation Type: Symbols on the map denote the type of precipitation expected. Common symbols include:
- Rain: Dots or filled circles.
- Snow: Asterisks or stars.
- Thunderstorms: An 'R' or a cloud with a lightning bolt.
- Time Frames: Rain maps often display precipitation forecasts over various time intervals, such as hourly, daily, or weekly, allowing for detailed planning.
How to Read a Rain Map
-
Identify the Legend: Start by reviewing the map's legend to understand the color codes and symbols used.
-
Examine the Color Gradient: Observe the color gradient to assess the expected intensity of rainfall in different regions.
-
Interpret Symbols: Look for symbols indicating the type of precipitation and any associated weather phenomena, such as thunderstorms.
-
Consider Time Frames: Pay attention to the time frames provided to understand when and where precipitation is expected.
Clime's Advanced Features for Enhanced Rain Mapping
Clime offers a suite of advanced tools designed to provide accurate and real-time precipitation data:
-
Interactive Rain Maps: Clime's interactive maps allow users to zoom in on specific regions, providing detailed precipitation forecasts tailored to your location.
-
Real-Time Updates: With Clime, you receive up-to-date information on rainfall intensity and duration, ensuring you have the latest data for your planning needs.
-
Customizable Alerts: Set personalized notifications to stay informed about upcoming rain events, helping you make timely decisions.
Practical Example
Imagine you're planning an outdoor event in Los Angeles. By using Clime's interactive rain maps, you can check the forecast for the specific date and time of your event. If the map indicates light rain (green) with a chance of thunderstorms (symbolized by an 'R'), you can prepare accordingly by arranging for shelter or rescheduling if necessary.
Conclusion
Understanding how to read rain maps is essential for effective weather forecasting and planning. By familiarizing yourself with the key components and utilizing Clime's advanced features, you can stay informed and make decisions based on accurate, real-time data.
For a visual demonstration on reading weather maps, you might find this video helpful: