
Understanding Rain Rate Maps in 2026: A Comprehensive Guide
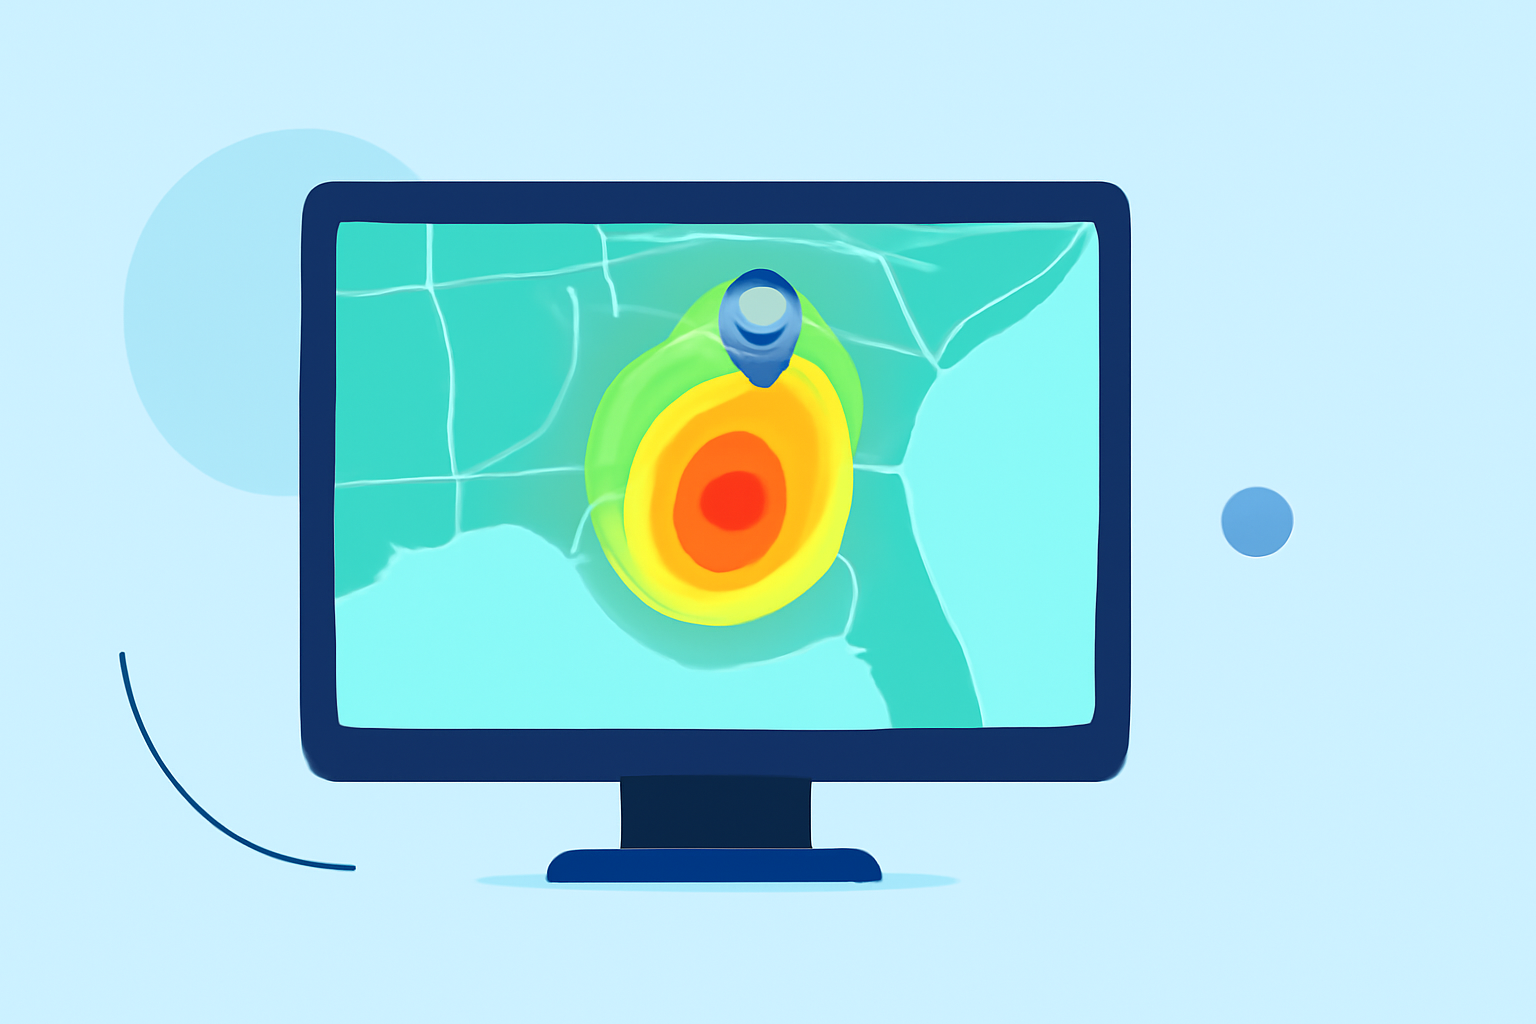
Rain rate maps are essential tools in meteorology, offering real-time insights into precipitation intensity and distribution. In 2026, these maps have become more sophisticated, integrating data from various sources to provide accurate and timely information.
What Are Rain Rate Maps?
Rain rate maps visually represent the intensity of rainfall over a specific area and time period. They display the rate at which rain is falling, typically measured in millimeters or inches per hour. These maps are crucial for understanding weather patterns, predicting potential flooding, and making informed decisions in sectors like agriculture, urban planning, and emergency management.
How Are Rain Rates Measured?
Rain rates are determined using several methods:
-
Weather Radar: Doppler radar systems emit signals that bounce off precipitation particles, allowing meteorologists to estimate rainfall rates based on the returned signals. The National Oceanic and Atmospheric Administration (NOAA) provides reflectivity data, which correlates radar reflectivity values (dBZ) to rainfall rates. For instance, a dBZ value of 60 corresponds to a rainfall rate of approximately 8.00 inches per hour. (prod-01-alb-www-noaa.woc.noaa.gov)
-
Satellite Observations: Satellites equipped with specialized sensors can detect cloud properties and surface conditions, enabling the estimation of rainfall rates. NASA's Global Precipitation Measurement (GPM) mission offers data on total rainfall, highlighting global precipitation patterns. (science.nasa.gov)
-
Ground-Based Instruments: Rain gauges and disdrometers installed at various locations provide direct measurements of rainfall rates, contributing to the calibration and validation of remote sensing data.
Interpreting Rain Rate Maps
Rain rate maps use color gradients to indicate varying levels of precipitation intensity:
-
Light Blue to Dark Blue: Indicate light to moderate rainfall rates.
-
Green to Yellow: Signify moderate to heavy rainfall.
-
Orange to Red: Represent heavy to torrential rainfall.
Understanding these color codes is vital for assessing weather conditions and potential hazards.
Applications of Rain Rate Maps
Rain rate maps are utilized in various fields:
-
Weather Forecasting: They assist meteorologists in predicting short-term weather events and issuing timely warnings.
-
Flood Management: By identifying areas of intense rainfall, these maps help in flood risk assessment and management.
-
Agriculture: Farmers use rain rate data to plan irrigation and harvest schedules.
-
Urban Planning: City planners consider rainfall patterns for infrastructure development, ensuring effective drainage systems.
Clime's Role in Providing Accurate Rain Rate Data
Clime offers advanced tools that deliver precise, real-time precipitation data, enhancing weather forecasting and planning. By integrating data from multiple sources, Clime ensures comprehensive and up-to-date rain rate information, empowering users to make informed decisions.
Conclusion
Rain rate maps are indispensable in understanding and predicting precipitation patterns. In 2026, advancements in technology have made these maps more accurate and accessible. Clime's commitment to providing reliable rain rate data supports various sectors in effective decision-making and planning.
Highlights:
- Total Rainfall - NASA Science, Published on Sunday, November 16
- Radar Images: Reflectivity | National Oceanic and Atmospheric Administration
- STAR Satellite Rainfall Estimation, Published on Sunday, May 10