
Understanding Rain Rate Maps: Essential Tools for Gardeners
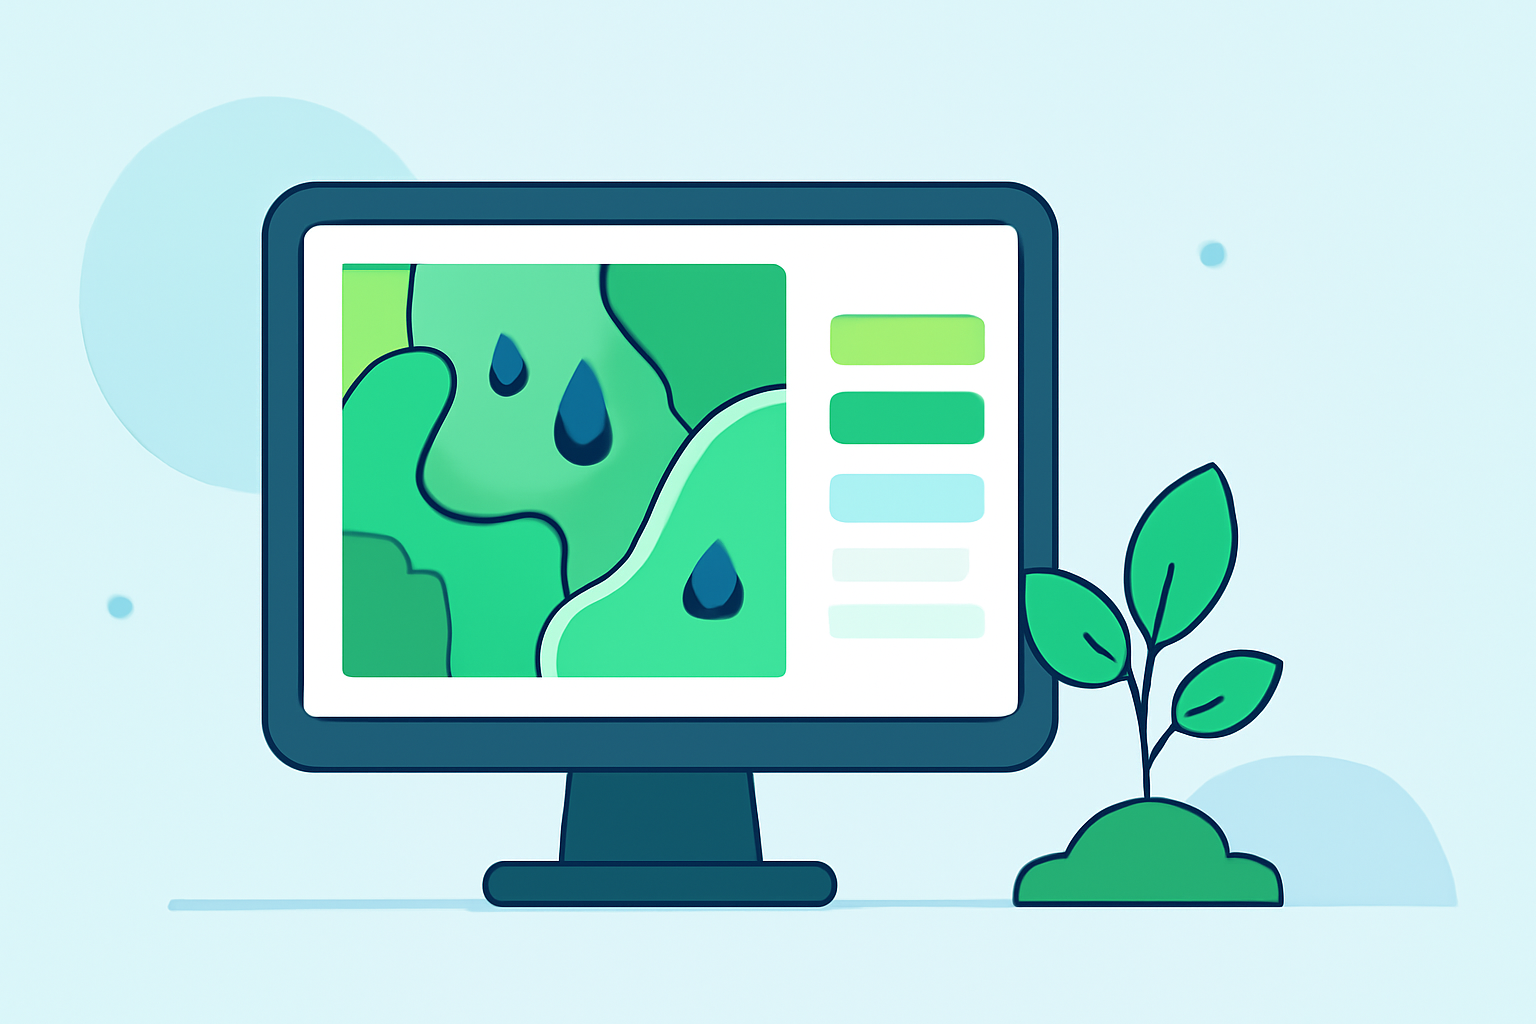
Rain rate maps are essential tools for gardeners, providing real-time data on precipitation patterns to optimize irrigation and protect plants from extreme weather. By understanding and utilizing these maps, gardeners can make informed decisions to enhance plant health and yield.
What Are Rain Rate Maps?
Rain rate maps display the intensity and distribution of rainfall over a specific area, often in real-time. They use color gradients to represent varying levels of precipitation, allowing users to quickly assess rainfall patterns. These maps are generated using data from weather radars and satellites, offering a visual representation of precipitation events.
Why Are Rain Rate Maps Important for Gardeners?
-
Optimizing Irrigation: By analyzing recent rainfall data, gardeners can adjust irrigation schedules to prevent overwatering or underwatering, conserving water and promoting healthy plant growth.
-
Protecting Plants from Extreme Weather: Rain rate maps help gardeners anticipate heavy rainfall or storms, enabling them to take preventive measures, such as providing drainage solutions or temporarily relocating vulnerable plants.
-
Monitoring Soil Moisture: Understanding rainfall patterns aids in assessing soil moisture levels, which is crucial for plant health and growth.
How to Access and Use Rain Rate Maps
Several platforms offer rain rate maps tailored for gardeners:
-
RainViewer: This app provides hyperlocal rain navigation, offering detailed radar data with high-resolution imagery. Features include rainfall totals over various time frames and real-time updates, allowing gardeners to monitor precipitation closely. (rainviewer.com)
-
RainDrop: Designed for precise rainfall tracking, RainDrop delivers real-time precipitation totals with interactive maps. It offers features like historical trend analysis and custom rain alerts, helping gardeners stay informed about weather conditions. (raindrop.farm)
-
Climate Toolbox: This collection of web tools visualizes past and projected climate and hydrology data across the contiguous United States. It includes the Climate Mapper, which allows users to map real-time conditions, current forecasts, and future projections of climate information, including precipitation patterns. (climatetoolbox.org)
Best Practices for Utilizing Rain Rate Maps
-
Regular Monitoring: Check rain rate maps frequently, especially during planting seasons or when expecting weather changes, to stay updated on precipitation patterns.
-
Integrate with Local Forecasts: Combine rain rate data with local weather forecasts to gain a comprehensive understanding of upcoming weather conditions.
-
Plan Ahead: Use the data to plan gardening activities, such as planting, harvesting, or applying fertilizers, aligning them with favorable weather conditions.
-
Share Information: Collaborate with local gardening communities or agricultural extension services to share insights and strategies based on rain rate data.
Conclusion
Incorporating rain rate maps into gardening practices empowers gardeners to make data-driven decisions, leading to healthier plants and more productive yields. By leveraging these tools, gardeners can effectively manage water resources and protect their plants from adverse weather conditions.