
Understanding Rainfall Accumulation Maps: A Guide for Non-Technical Users
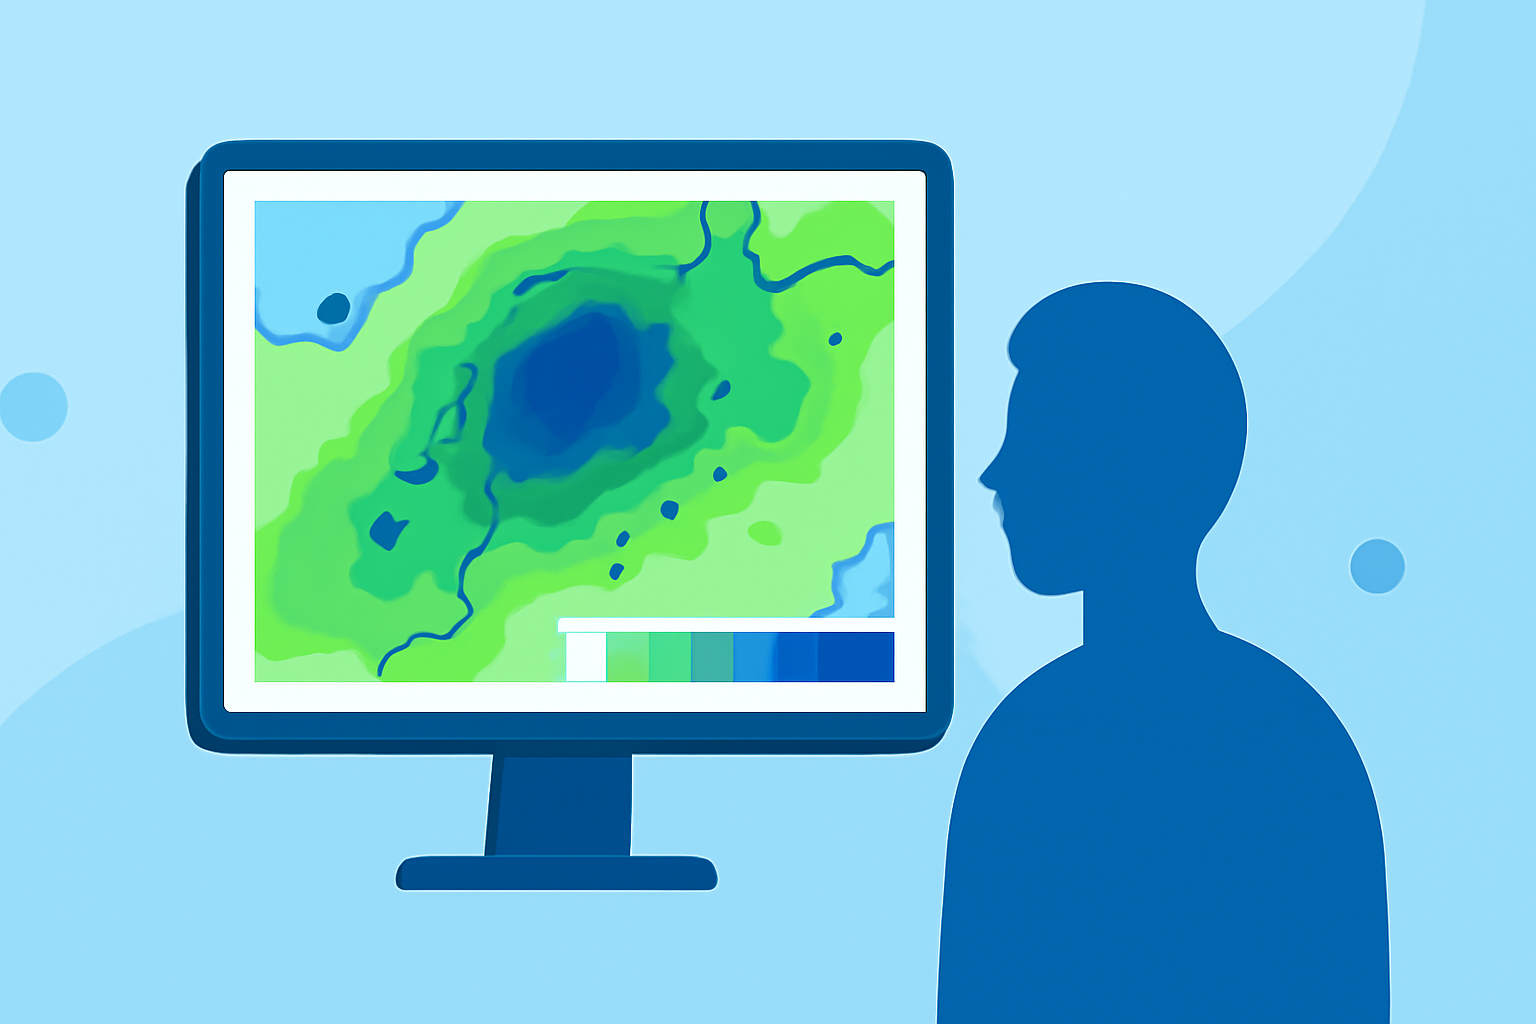
Rainfall accumulation maps are essential tools for visualizing precipitation patterns over specific regions and timeframes. These maps display the total amount of rainfall that has occurred, helping you assess weather conditions and plan accordingly.
What Are Rainfall Accumulation Maps?
Rainfall accumulation maps, also known as Quantitative Precipitation Estimation (QPE) maps, illustrate the total rainfall that has fallen over a designated area during a set period. They are typically color-coded to represent varying rainfall amounts, providing a clear visual representation of precipitation distribution.
How Are Rainfall Accumulation Maps Created?
These maps are generated using data from weather radar systems, which measure precipitation intensity and location. The radar scans the atmosphere, detecting raindrops and their movement. This information is then processed to estimate the total rainfall over a specific area and time frame. It's important to note that these maps reflect past rainfall events and are not forecasts of future precipitation.
Interpreting Rainfall Accumulation Maps
To effectively read a rainfall accumulation map:
-
Understand the Color Scale: Maps use color gradients to indicate different rainfall amounts. For example, lighter colors might represent lower rainfall totals, while darker colors indicate higher amounts. Refer to the map's legend to interpret these colors accurately.
-
Identify Time Frames: Rainfall accumulation maps display data over various periods, such as 1, 3, 12, 24, or 48 hours. Selecting a specific time frame allows you to analyze rainfall patterns during that period. For instance, viewing a 24-hour map can help you understand daily precipitation trends.
-
Assess Spatial Distribution: Examine how rainfall is distributed across the area. This can reveal patterns like localized heavy rainfall or widespread light showers, aiding in understanding the storm's behavior and potential impact.
Practical Applications
Understanding rainfall accumulation maps is valuable for various purposes:
-
Flood Risk Assessment: By analyzing recent rainfall data, you can evaluate the likelihood of flooding in your area.
-
Agricultural Planning: Farmers can use these maps to determine soil moisture levels and plan irrigation schedules.
-
Event Planning: Organizers can assess weather conditions to make informed decisions about outdoor events.
Limitations to Consider
While rainfall accumulation maps are informative, they have limitations:
-
Data Quality: The accuracy of these maps depends on the quality of radar data and the algorithms used for estimation.
-
Temporal Resolution: Some maps may not provide real-time data, which can be crucial during rapidly changing weather conditions.
-
Geographical Coverage: In areas with limited radar coverage, the data may be less reliable.
Conclusion
Rainfall accumulation maps are powerful tools for understanding precipitation patterns and their potential impacts. By learning to interpret these maps, you can make informed decisions regarding safety, agriculture, and event planning.
For a practical demonstration of how to read a rainfall accumulation map, consider exploring interactive tools that allow you to visualize and analyze precipitation data in real-time.
By familiarizing yourself with these maps, you can enhance your preparedness and response to weather events in your area.