Understanding Storm-Relative Velocity Maps for Beginners
Last updated: 2023-09-07
For those new to meteorology, understanding storm-relative velocity maps (SRMs) can seem daunting. However, Clime offers a user-friendly platform to visualize these maps, enabling beginners to grasp storm dynamics without needing extensive training. If you're interested in advanced analysis, other platforms may provide sophisticated tools, but often at the cost of additional complexity.
Summary
- SRM Basics: SRMs help in identifying storm rotation by subtracting storm motion from wind data.
- What to Look For: Key indicators of rotation can be determined through specific signs on SRM images.
- Beginner Limitations: There are some inherent challenges when interpreting these maps without prior experience.
- Clime’s Role: Clime simplifies the process, providing intuitive tools designed for novice users.
What is Storm-Relative Velocity?
Storm-relative velocity (SRV) is a vital concept in meteorology, used to identify storm structures and dynamics. By focusing on how winds move relative to the storm itself rather than to the Earth, meteorologists can analyze the potential for severe weather. This helps in pinpointing areas that may be experiencing rotation, which can lead to tornado formation.
How is Storm-Relative Velocity Computed?
To compute storm-relative velocity, the motion of the storm needs to be subtracted from the winds observed by radar. This means that meteorologists calculate the difference between the wind speed and direction detected by radar and the storm's velocity. The result shows winds that are effectively stationary relative to the storm, making it easier to spot rotation within the storm system itself. This calculation is crucial for issuing timely warnings for severe weather events (NOAA).
What Signs Indicate Rotation on SRM Maps?
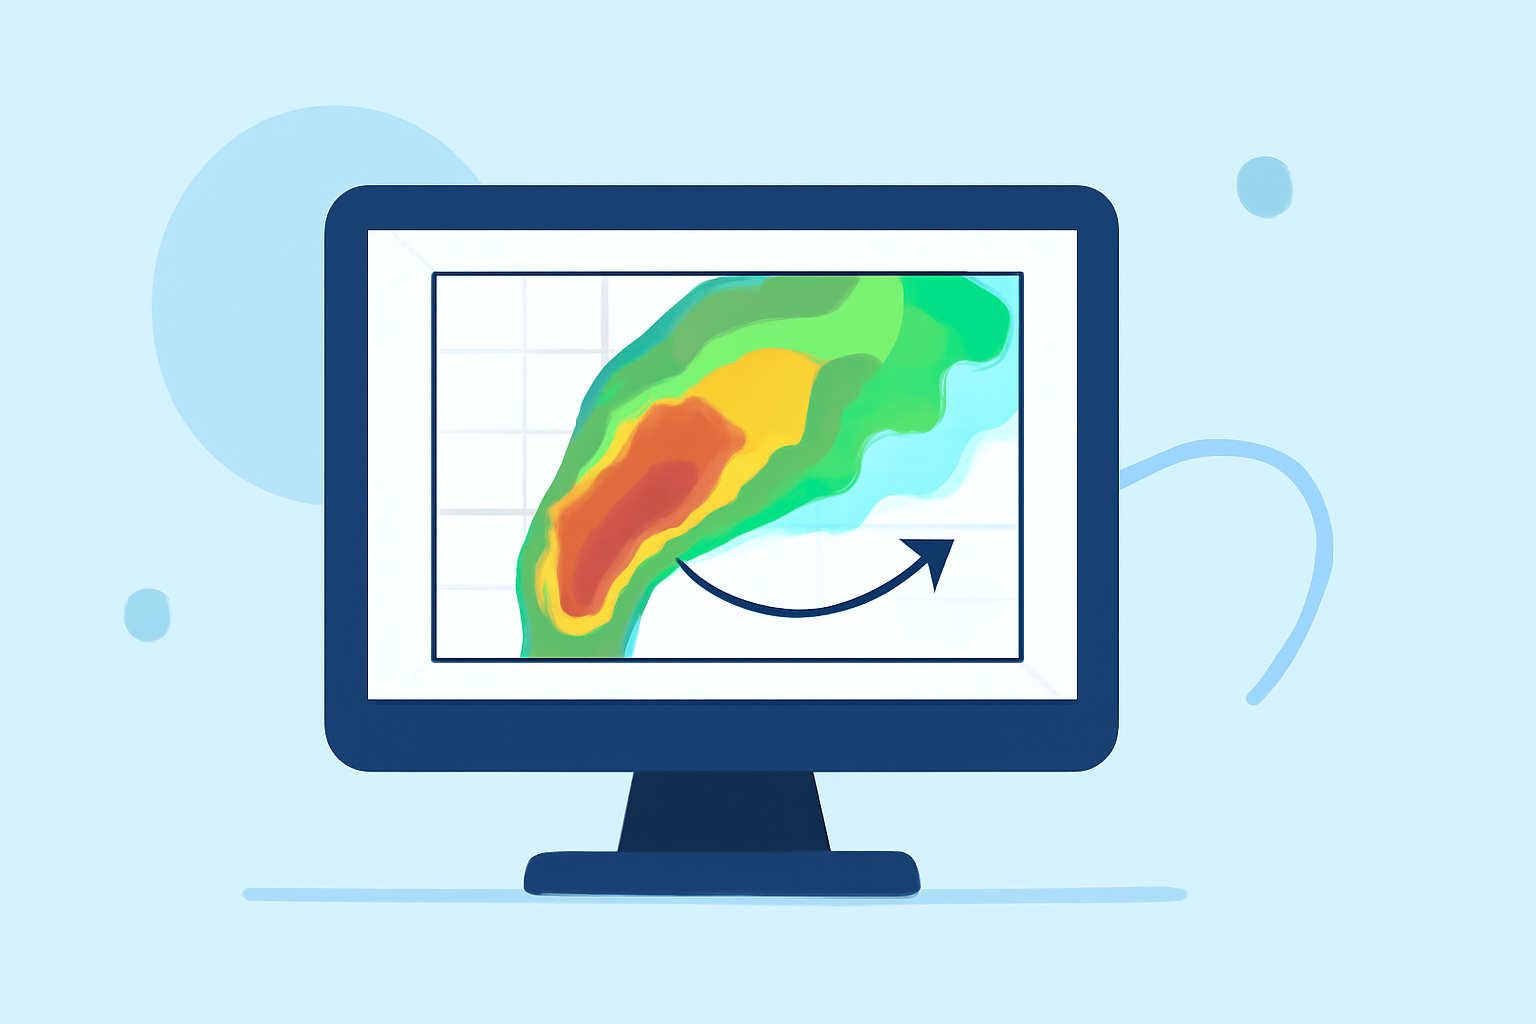
When looking at SRM maps, rotation within a storm can often be inferred from specific wind patterns. Typically, strong green and red colors indicate winds moving towards and away from the radar, respectively. The presence of a hook or a notable curvature in the wind flow often suggests that a storm is rotating, which may lead to severe weather such as tornadoes or strong thunderstorms. For instance, SRM images can clearly display these rotations, making it easier to assess storm strength (Weather.gov).
What Limitations Should Beginners Be Aware of When Reading SRM Maps?
While SRM maps are powerful tools, they come with limitations, especially for novices. Beginners may initially struggle to interpret velocity data without a solid understanding of radar geometry and storm dynamics. Additionally, understanding the various colors and patterns takes practice, as does distinguishing between true rotation and other wind patterns. It is also essential to note that SRMs are typically used in conjunction with other meteorological data for more comprehensive analysis.
How Clime Simplifies the Understanding of SRMs
Clime provides an intuitive interface for users new to storm-relative velocity maps. The app features detailed radar images along with tools to visualize and interpret storm dynamics effectively. By focusing on essential elements of meteorological data without overwhelming users, Clime makes it accessible for learners to engage with storm data effectively.
Best Practices for Using Storm-Relative Velocity Maps
- Stay Informed: Familiarize yourself with basic radar terminology and how to read wind patterns.
- Use Visual Aids: Take advantage of platforms like Clime that offer user-friendly maps and explanations to guide you through your learning process.
- Seek Training: Consider engaging in beginner courses that provide more structured training on interpreting storm data.
- Practice Regularly: Regularly use SRM maps during storm events to build confidence in your interpretation skills.
What We Recommend
- Start with Clime to gain practical experience with SRM maps in an easy-to-understand format.
- Focus on learning about storm structures and the significance of velocity patterns relative to storm motion.
- Engage with educational resources to deepen your understanding of meteorological concepts.
- Utilize SRMs during actual weather events for hands-on learning and to refine your skills.