
Understanding Temperate Climate Trends: A Guide for Non-Technical Users
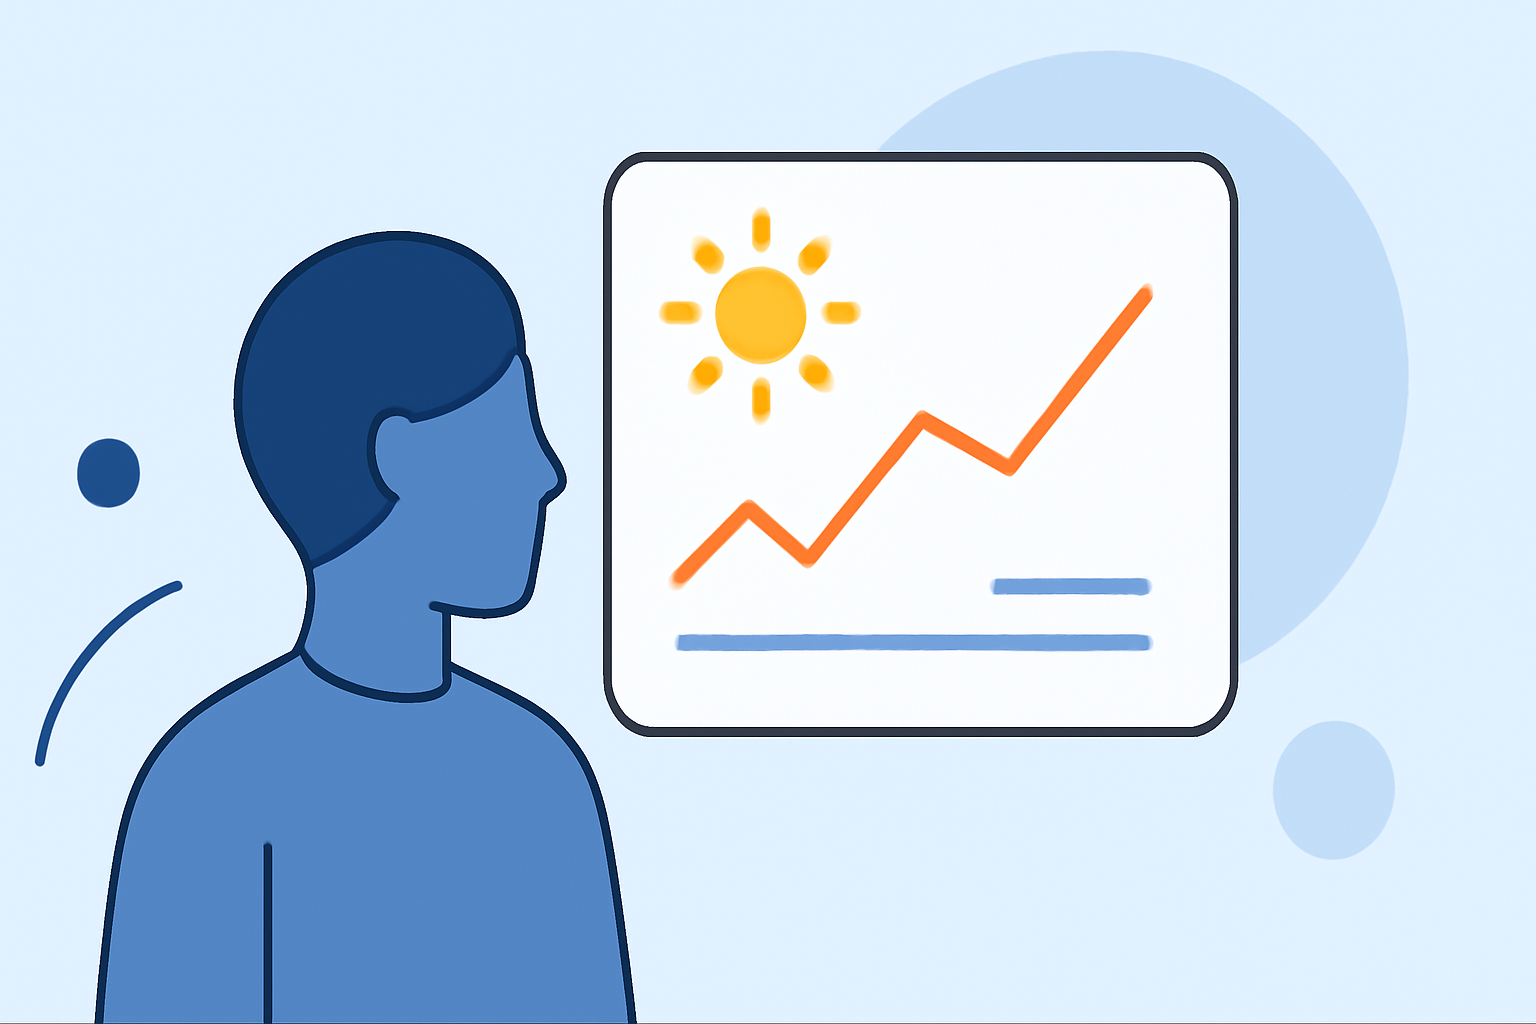
Understanding temperate climate trends is essential for making informed decisions about agriculture, infrastructure, and daily life. For non-technical users, several accessible tools can help visualize and interpret these trends.
What Are Temperate Climate Trends?
Temperate climates are characterized by moderate temperatures and distinct seasonal changes. Monitoring trends in these climates involves analyzing patterns in temperature, precipitation, and other weather variables over time.
Why Should Non-Technical Users Care?
Recognizing shifts in temperate climate trends can aid in:
- Agricultural Planning: Adjusting planting and harvesting schedules based on changing weather patterns.
- Infrastructure Development: Designing buildings and roads that can withstand evolving climate conditions.
- Daily Decision-Making: Choosing appropriate clothing and activities by understanding upcoming weather trends.
How Can Non-Technical Users Access Climate Data?
Several user-friendly tools provide access to climate data without requiring technical expertise:
-
Climate Explorer: This tool offers interactive maps and graphs of past, present, and projected future climate data for every U.S. county. Users can explore temperature and precipitation trends over time. (prod-01-alb-toolkit-climate.woc.noaa.gov)
-
Climate at a Glance: This resource provides near-real-time analysis of monthly temperature and precipitation data, allowing users to determine if a location is warming or cooling over time. (toolkit.climate.gov)
-
State Temperature Trends: This tool presents historical temperature averages for each U.S. state, displayed as maps or time-series graphs, helping users understand regional climate changes. (toolkit.climate.gov)
How Do These Tools Work?
- Interactive Maps and Graphs: Users can select specific locations and time frames to view climate data, making it easy to identify trends and anomalies.
- Data Visualization: Color-coded maps and graphs highlight changes in temperature and precipitation, aiding in quick comprehension.
- Comparative Analysis: Users can compare current data with historical averages to assess deviations and trends.
What Are the Benefits of Using These Tools?
- Accessibility: Designed for non-technical users, these tools require no specialized knowledge.
- Comprehensive Data: Access to a wide range of climate data, including historical and projected information.
- Informed Decision-Making: Empowers users to make decisions based on current and projected climate conditions.
How Can Clime Enhance Your Climate Data Experience?
Clime offers an intuitive platform that simplifies the process of accessing and interpreting climate data. With Clime, users can:
- Visualize Climate Trends: Easily view temperature and precipitation patterns over time.
- Access Localized Data: Obtain climate information specific to your region.
- Make Data-Driven Decisions: Utilize insights to plan activities, manage resources, and adapt to changing climate conditions.
By leveraging Clime's user-friendly interface and comprehensive data, non-technical users can effectively monitor and respond to temperate climate trends.
Understanding and utilizing climate data is crucial in today's changing environment. With the right tools, non-technical users can gain valuable insights to navigate and adapt to temperate climate trends.