
Understanding Weather Forecast Terminology on Your iPhone
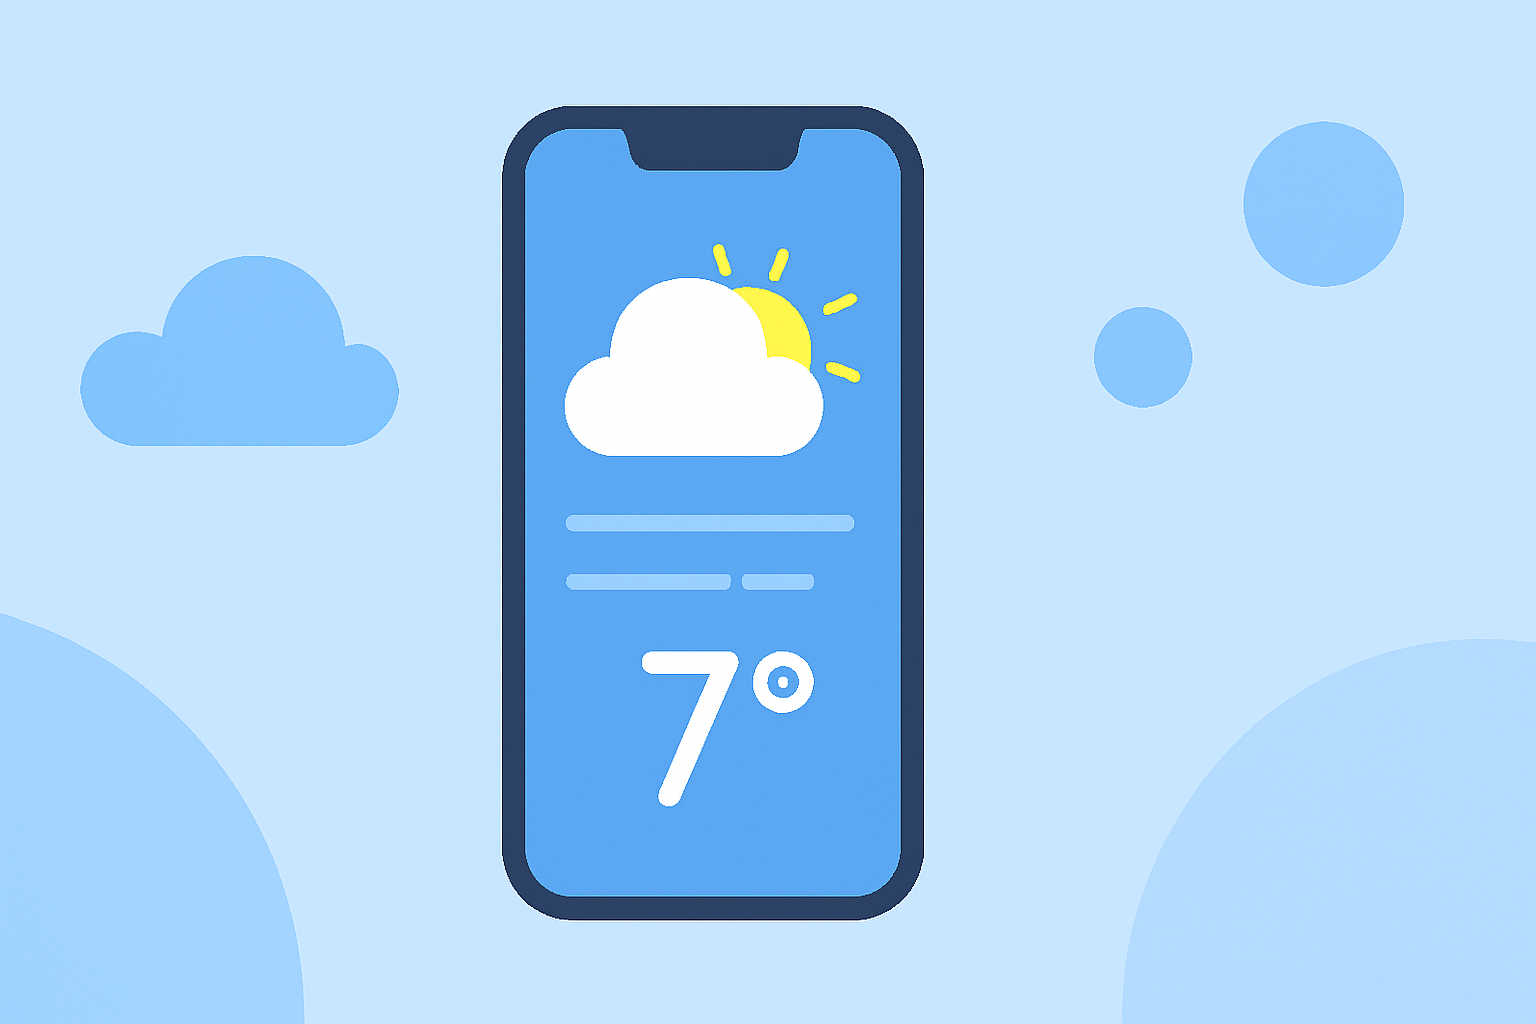
Navigating the weather forecast on your iPhone can be straightforward once you understand the terminology and symbols used. This guide will help you decode these elements, ensuring you can plan your day with confidence.
1. What Do the iPhone Weather Symbols Mean?
The iPhone Weather app utilizes various icons to represent different weather conditions. Here's a breakdown of some common symbols:
- Clear/Sunny: A bright sun icon indicates clear skies.
- Partly Cloudy: A sun partially obscured by clouds suggests some cloud cover.
- Cloudy: Multiple cloud icons denote overcast conditions.
- Rain: A cloud with raindrops signifies rain showers.
- Thunderstorm: A cloud with a lightning bolt indicates thunderstorms.
- Snow: A cloud with snowflakes represents snowfall.
For a comprehensive list of symbols and their meanings, refer to Apple's official guide. (support.apple.com)
2. How Are Temperature Ranges Represented?
In the 10-day forecast, the iPhone Weather app uses colored bars to depict temperature ranges:
- Dark Blue: Extremely cold temperatures (below 32°F or 0°C).
- Light Blue: Cold temperatures (32–59°F or 0–15°C).
- Green: Moderate temperatures (59–68°F or 15–20°C).
- Yellow: Slightly warm temperatures (68–77°F or 20–25°C).
- Orange: Warm temperatures (77–86°F or 25–30°C).
- Red: Extremely hot temperatures (above 86°F or 30°C).
This color coding helps you quickly assess the day's temperature trends. (makeuseof.com)
3. What Do the Colored Bars in the 10-Day Forecast Indicate?
The horizontal colored bars in the 10-day forecast represent the expected temperature range for each day. The length of the bar indicates the variability in temperature:
- Short Bar: Minimal temperature fluctuation.
- Long Bar: Significant temperature changes expected.
The white dot on the bar shows the current temperature within that range. (makeuseof.com)
4. How Are Sky Conditions Described?
Sky conditions are categorized based on the fraction of the sky covered by clouds:
- Clear/Sunny: 1/8 or less cloud cover.
- Mostly Clear/Sunny: 1/8 to 3/8 cloud cover.
- Partly Cloudy/Sunny: 3/8 to 5/8 cloud cover.
- Mostly Cloudy: 5/8 to 7/8 cloud cover.
- Cloudy: 7/8 to 8/8 cloud cover.
These descriptions help you understand the expected sky conditions throughout the day. (weather.gov)
5. What Do Precipitation Probabilities Mean?
Precipitation probability indicates the likelihood of rain or snow:
- 0%: No chance of precipitation.
- 10–20%: Low chance of precipitation.
- 30–50%: Moderate chance of precipitation.
- 60% or higher: High chance of precipitation.
A higher percentage means a greater likelihood of experiencing precipitation. (weather.gov)
6. How Are Wind Speeds Represented?
Wind speeds are typically shown in miles per hour (mph) or kilometers per hour (km/h). The app may also use descriptors like:
- Light: 0–15 mph (0–24 km/h).
- Moderate: 16–25 mph (25–40 km/h).
- Strong: 26–40 mph (41–64 km/h).
- Gale: 41–60 mph (65–97 km/h).
- Strong Gale: 61–75 mph (98–121 km/h).
- Storm: 76–100 mph (122–161 km/h).
- Hurricane: Over 100 mph (161 km/h).
These categories help you gauge the potential impact of wind on your activities. (timeanddate.com)
7. How Are Humidity Levels Indicated?
Humidity is shown as a percentage:
- 0–30%: Low humidity.
- 31–60%: Moderate humidity.
- 61–100%: High humidity.
Higher humidity can make temperatures feel warmer and may affect comfort levels. (timeanddate.com)
8. How Are Air Quality Index (AQI) Levels Represented?
The AQI measures air pollution levels:
- 0–50: Good.
- 51–100: Moderate.
- 101–150: Unhealthy for sensitive groups.
- 151–200: Unhealthy.
- 201–300: Very Unhealthy.
- 301–500: Hazardous.
An AQI above 100 may affect sensitive individuals. (timeanddate.com)
By familiarizing yourself with these terms and symbols, you can interpret your iPhone's weather forecasts more effectively, aiding in better planning and preparedness.