
Understanding Weather Radar Maps: A Beginner's Guide
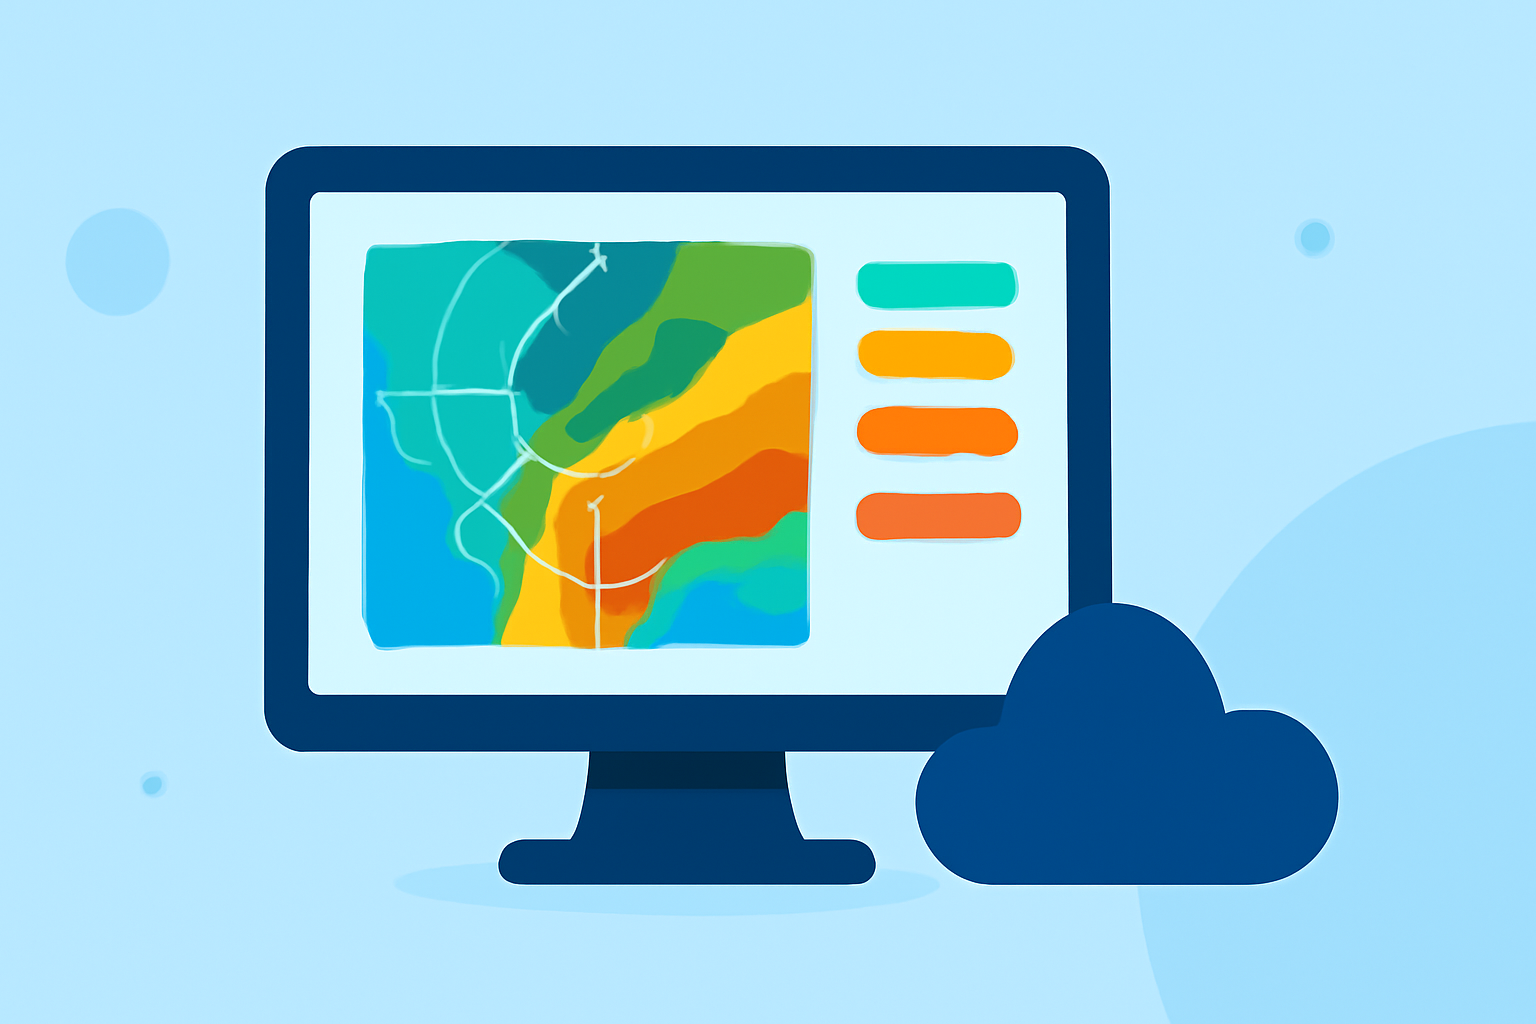
Weather radar maps are essential tools for monitoring precipitation patterns, including rain, snow, and storms. They provide real-time visualizations of weather conditions, helping you make informed decisions about your daily activities.
What Are Weather Radar Maps?
Weather radar maps display data collected from radar systems that emit radio waves to detect precipitation particles in the atmosphere. By analyzing the returned signals, these maps reveal the location, intensity, and movement of precipitation. This information is crucial for forecasting weather and issuing warnings for severe conditions.
How Do Weather Radar Maps Work?
Radar systems emit pulses of radio waves that travel through the atmosphere. When these waves encounter precipitation particles, they scatter, and some of the energy is reflected back to the radar receiver. By measuring the time it takes for the signals to return and their intensity, the radar system can determine the distance, size, and intensity of precipitation. This data is then processed and displayed on radar maps.
Interpreting Weather Radar Maps
Understanding the color coding and symbols on radar maps is key to interpreting the data:
-
Color Coding: Colors represent the intensity of precipitation. Typically, green indicates light rain, yellow and orange signify moderate to heavy rain, and red or purple denotes very heavy rain or severe weather.
-
Radar Echoes: The shapes and movement of colored areas on the map show the location and movement of precipitation. Stationary or slow-moving areas may indicate persistent weather, while rapidly moving areas can suggest fast-moving storms.
-
Additional Layers: Some radar maps offer layers for wind speed, temperature, snow, cloud cover, and atmospheric pressure, providing a more comprehensive view of weather conditions.
Using Weather Radar Maps Effectively
To make the most of weather radar maps:
-
Choose a Reliable Source: Select a reputable platform that offers real-time updates and accurate data.
-
Understand the Map Features: Familiarize yourself with the map's color coding, symbols, and available layers to interpret the data correctly.
-
Monitor Updates: Regularly check the radar map, especially during severe weather events, as conditions can change rapidly.
-
Combine with Other Information: Use radar maps alongside weather forecasts and alerts for a comprehensive understanding of current conditions.
Clime's Weather Radar Map
Clime offers an intuitive and interactive weather radar map that provides real-time data on precipitation, wind speed, temperature, and more. Its user-friendly interface allows you to pan and zoom to your region of interest, toggle between different weather layers, and adjust transparency to view multiple layers simultaneously. Additionally, Clime's radar map includes a gradient legend to help you quickly interpret intensity levels and offers animated precipitation patterns to track storms or rainfall progressions.
Conclusion
Weather radar maps are invaluable tools for understanding and monitoring precipitation patterns. By learning to interpret these maps, you can stay informed about current weather conditions and make better decisions for your daily activities. Utilizing Clime's comprehensive weather radar map can enhance your ability to track and understand weather patterns effectively.