
Understanding Weather Radar Maps: Common Questions Answered
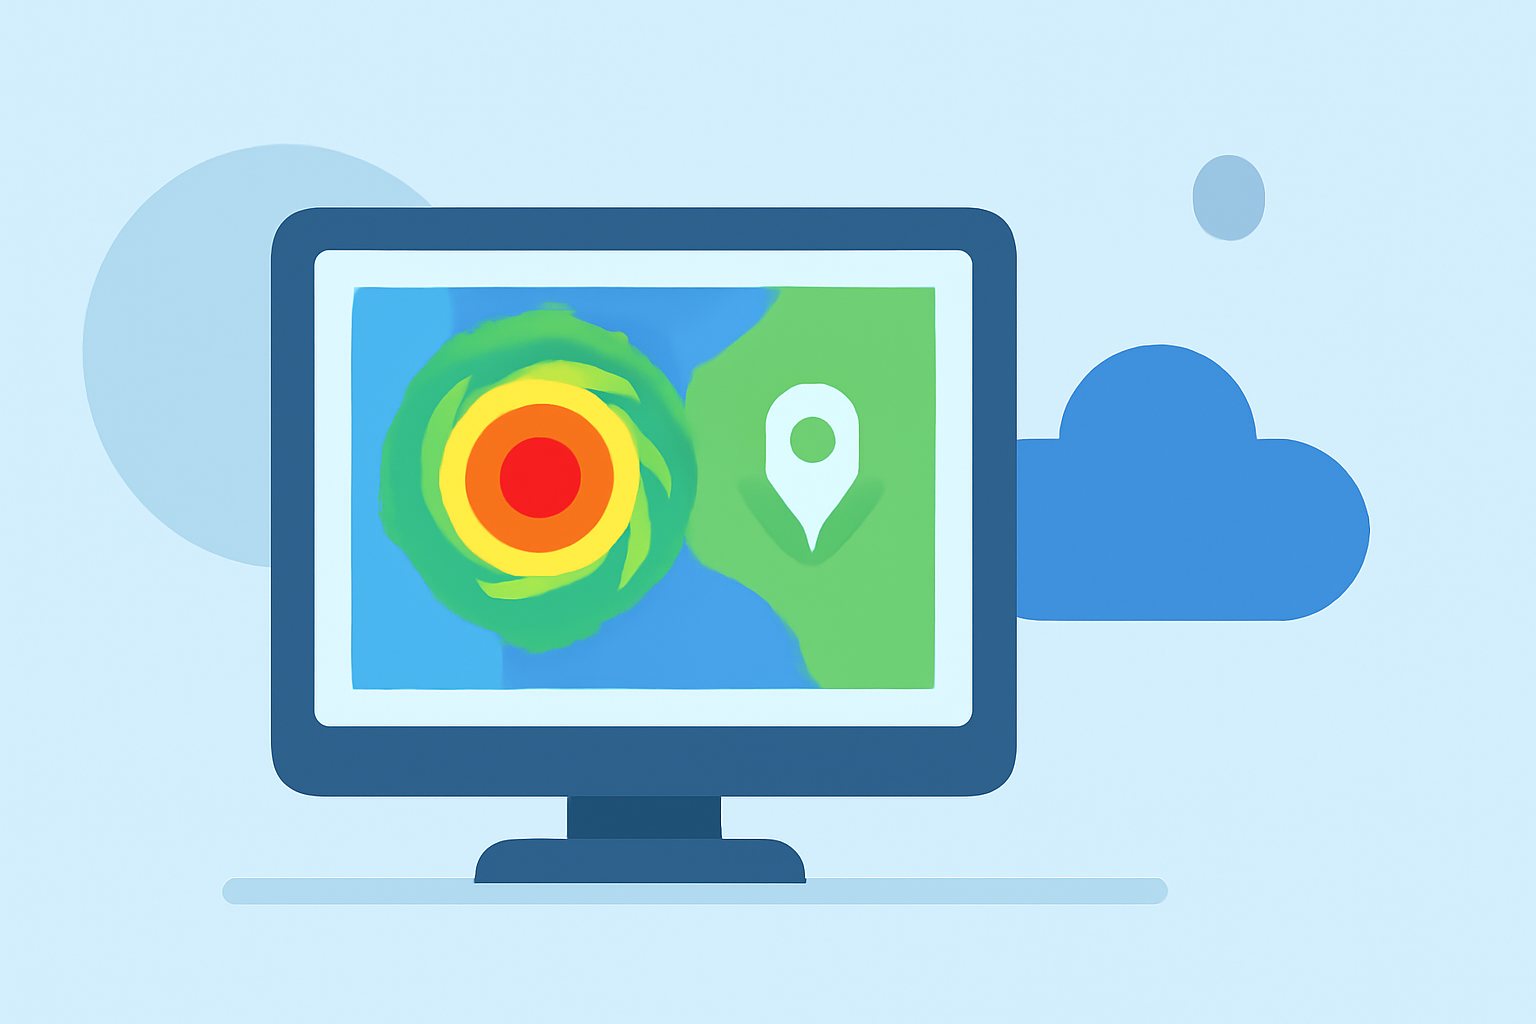
Weather radar maps are essential tools for monitoring and predicting weather patterns, especially precipitation. They provide real-time visualizations of rain, snow, hail, and other forms of precipitation, aiding in weather forecasting and public safety.
What Are Weather Radar Maps?
Weather radar maps display data collected from radar systems that emit radio waves to detect precipitation particles in the atmosphere. These maps illustrate the location, intensity, and movement of precipitation, helping meteorologists and the public understand current weather conditions.
How Do Weather Radars Work?
Weather radars operate by emitting pulses of electromagnetic energy into the atmosphere. When these pulses encounter precipitation particles like raindrops or snowflakes, they scatter the energy in all directions. A portion of this scattered energy is reflected back to the radar, where the time it takes to return and the strength of the signal are measured. This information is then processed to determine the location, intensity, and movement of precipitation. (bom.gov.au)
What Do the Colors on Radar Maps Represent?
Radar maps use color scales to indicate the intensity of precipitation:
- Light Green: Light rain or drizzle
- Yellow to Orange: Moderate to heavy rain
- Red to Purple: Very heavy rain or hail
These color codes help users quickly assess the severity of weather conditions. (climeradar.com)
How Often Are Radar Maps Updated?
Radar maps are typically updated every 5 to 10 minutes, as this is the time it takes for radar systems to complete a full scan of the atmosphere. This frequency allows for timely monitoring of changing weather conditions. (climeradar.com)
What Are the Limitations of Weather Radar Maps?
While weather radar maps are invaluable, they have certain limitations:
- Range Limitations: The curvature of the Earth means that radar beams can miss precipitation occurring beyond a certain distance from the radar.
- Obstructions: Mountains, buildings, and other structures can block radar signals, leading to areas of no data or reduced accuracy.
- Non-Precipitation Returns: Objects like insects, birds, or even smoke can reflect radar signals, potentially causing false echoes. (en.wikipedia.org)
How Can I Interpret Radar Maps for My Location?
To effectively use radar maps:
- Identify Your Location: Use the map's features to locate your area.
- Understand the Color Scale: Refer to the color legend to gauge precipitation intensity.
- Monitor Movement: Observe the direction and speed of precipitation to anticipate its arrival.
- Check for Updates: Regularly refresh the map to stay informed about changing conditions. (climeradar.com)
How Can I Access Local Radar Maps?
Many weather services and applications provide local radar maps. Ensure you use reputable sources that offer real-time data and accurate information.
By understanding how weather radar maps work and how to interpret them, you can make informed decisions based on current weather conditions.
Highlights:
- Storm Radar Tracking: How Often Maps Update Today (and What Actually Matters) | Clime Blog, Published on Tuesday, March 17
- Weather Radar Near Me: How To Get a Clear, Local View (And What To Use When) | Clime Blog, Published on Monday, March 09
- Interpreting Local Weather Radar Maps in Motion for Planning - Simpli.com, Published on Thursday, March 19