
Understanding Weather Radar Maps: A Comprehensive Guide
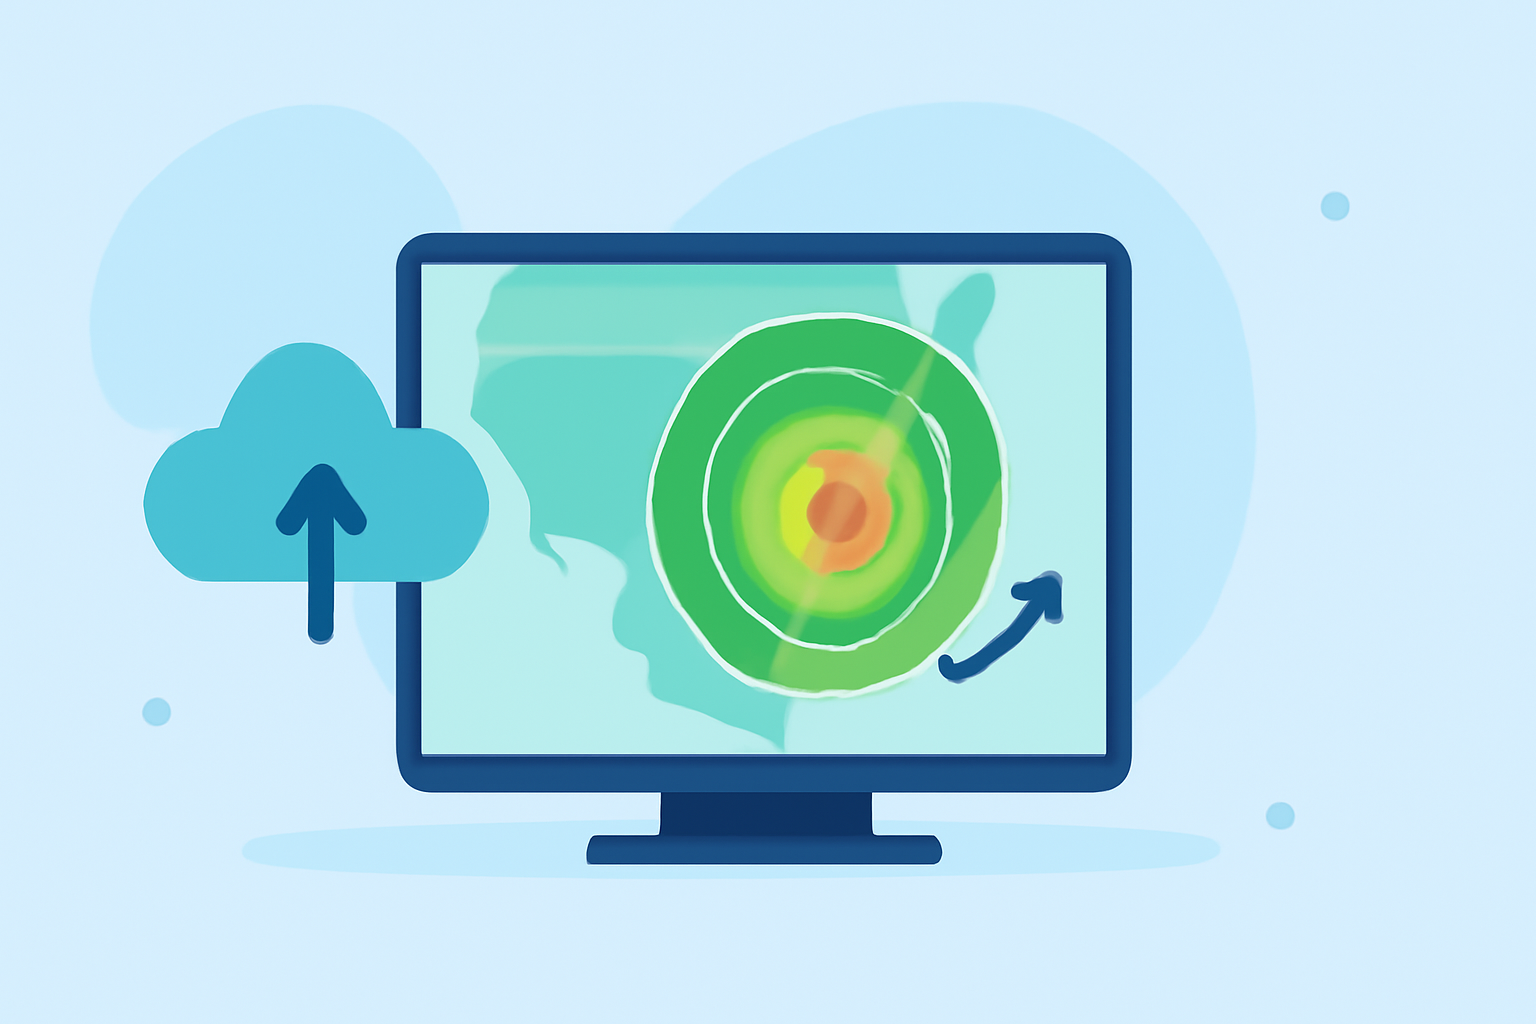
Weather radar maps are essential tools for monitoring and understanding weather patterns, especially when tracking storms and precipitation. By grasping the key components and interpreting the data presented, you can make informed decisions about weather-related activities.
What Are Weather Radar Maps?
Weather radar maps display real-time data collected by radar systems, illustrating precipitation intensity, movement, and type. These maps are crucial for forecasting weather conditions and issuing timely warnings for severe weather events.
Key Components of Weather Radar Maps
Understanding the following elements will enhance your ability to interpret radar maps:
1. Reflectivity
Reflectivity indicates the strength of the returned radar signal, correlating with precipitation intensity. Brighter colors typically represent heavier precipitation.
2. Velocity
Velocity data shows the speed and direction of precipitation particles, helping to identify wind patterns and potential rotation within storms.
3. Composite Reflectivity
This combines multiple radar scans to provide a comprehensive view of precipitation, highlighting areas of intense activity.
4. Dual-Polarization Data
Dual-polarization technology distinguishes between different types of precipitation (e.g., rain, snow, hail) and filters out non-meteorological echoes like birds or insects.
Interpreting Radar Map Colors
Radar maps use color scales to represent precipitation intensity:
- Light Green: Very light rain or drizzle.
- Dark Green: Light to moderate rain.
- Yellow: Moderate to heavy rain.
- Orange/Red: Heavy rain, strong storms, potential lightning, and gusty winds.
- Dark Red/Purple: Very intense storms, possible hail, and damaging winds.
- Blue/Pink (in winter): Snow, sleet, or freezing rain.
Understanding these color codes is vital for assessing the severity of weather conditions.
Practical Tips for Reading Radar Maps
To effectively interpret radar maps:
- Loop the Animation: Always view the radar loop to observe the movement and development of precipitation over time.
- Monitor Storm Motion: Identify the direction and speed of storm cells to anticipate their impact on your location.
- Check for Alerts: Look for any severe weather warnings or advisories associated with the radar data.
By following these steps, you can gain a clearer understanding of impending weather events and make informed decisions.
Utilizing Clime's Weather Radar Maps
Clime offers advanced weather radar maps that integrate real-time data with user-friendly features, enhancing your ability to monitor and interpret weather conditions effectively. With Clime, you can access detailed radar imagery, receive timely alerts, and make informed decisions based on the latest weather information.
Conclusion
Interpreting weather radar maps is a valuable skill for staying informed about weather conditions and making timely decisions. By understanding the key components, color codes, and practical interpretation tips, you can effectively monitor precipitation and storm activity. Leveraging Clime's advanced radar maps further enhances your ability to track and respond to changing weather patterns.
Highlights:
- Weather Radar Near Me: How To Get a Clear, Local View (And What To Use When) | Clime Blog, Published on Monday, March 09
- Radar Tracking Storms: How to Stay Ahead of Dangerous Weather | Clime Blog, Published on Monday, March 09