
Weather Station Data Workflow for Beginners
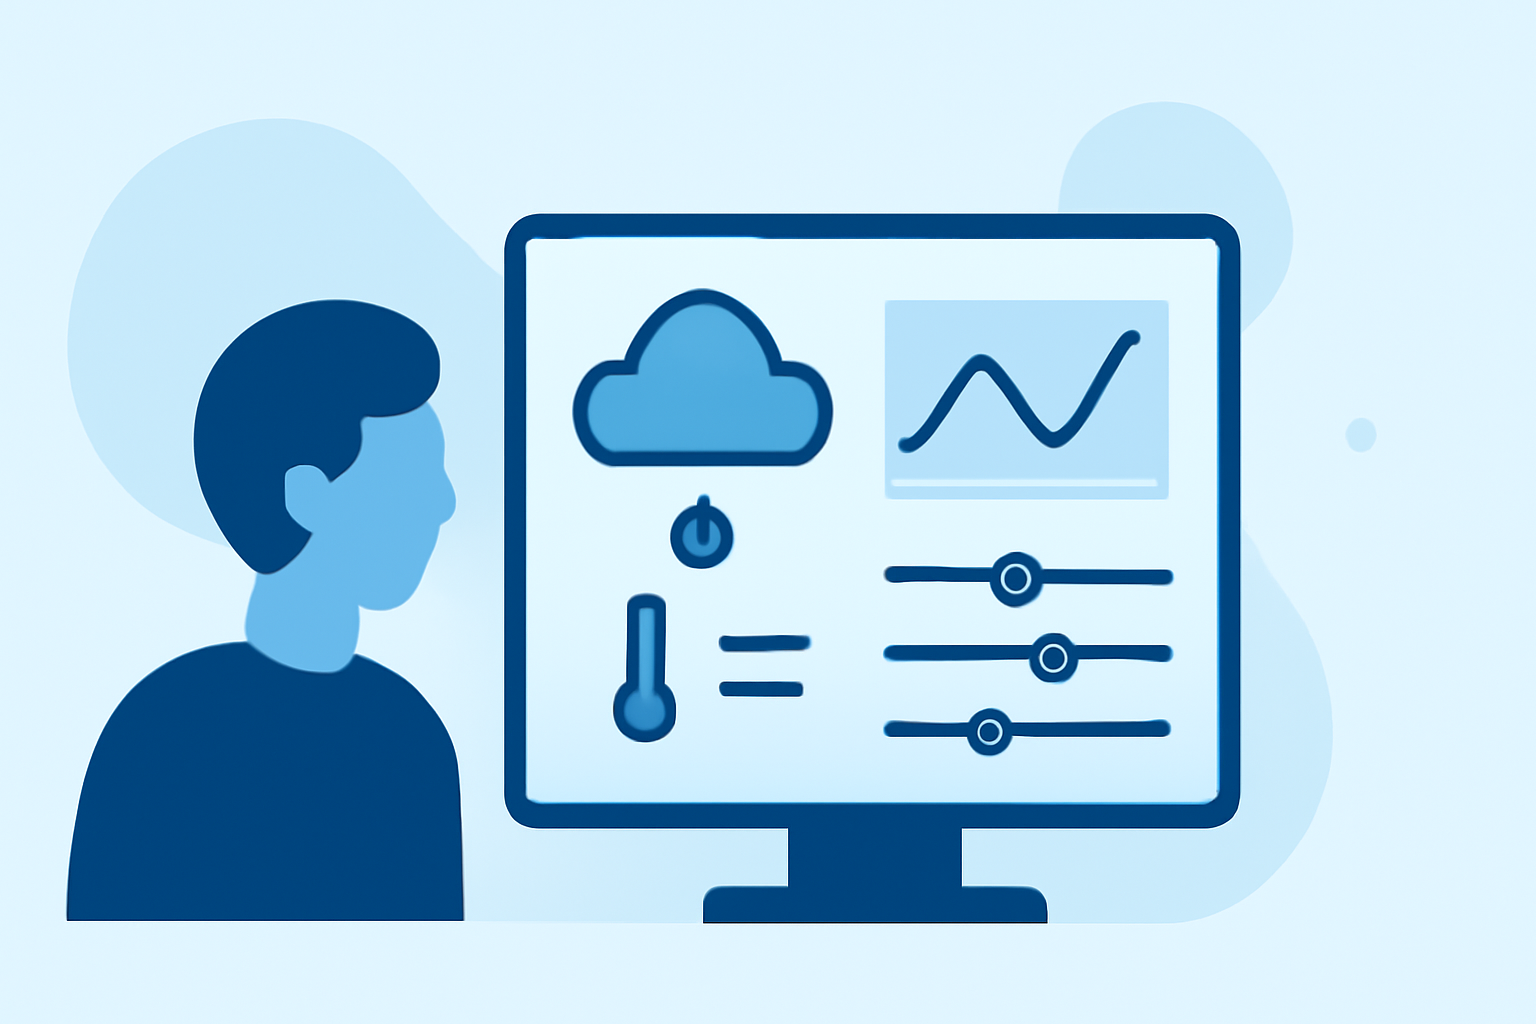
Embarking on the journey of weather station data management can be both exciting and rewarding. Whether you're a hobbyist meteorologist or someone interested in environmental monitoring, grasping the fundamentals of data collection, analysis, and sharing is essential.
What Is a Weather Station Data Workflow?
A weather station data workflow encompasses the entire process of capturing, processing, analyzing, and disseminating meteorological data. This includes setting up the station, collecting data, ensuring its accuracy, analyzing trends, and sharing the findings.
How Do I Set Up a Weather Station?
Setting up a weather station involves several key steps:
-
Selecting Appropriate Hardware: Choose sensors that measure parameters like temperature, humidity, wind speed, and precipitation.
-
Assembling the Station: Install the sensors in suitable locations, ensuring they are shielded from direct sunlight and precipitation to maintain data accuracy.
-
Connecting to a Data Logger or Computer: Use a data logger or computer to record and store the data from your sensors.
-
Calibrating Sensors: Regular calibration ensures the accuracy of your measurements.
For a detailed guide on building a Raspberry Pi-based weather station, you can refer to this resource. (aguilmard.com)
How Do I Collect and Store Data?
Data collection and storage are pivotal in the workflow:
-
Data Collection: Configure your data logger or computer to record data at regular intervals, such as every minute or hour.
-
Data Storage: Store the collected data in a structured format, like CSV files, which can be easily imported into analysis tools.
How Do I Analyze Weather Data?
Analyzing weather data involves several steps:
-
Data Import: Use software like Python with libraries such as Pandas to import your CSV files.
-
Data Cleaning: Handle missing values and outliers to ensure data quality.
-
Data Analysis: Calculate metrics like daily averages, identify trends, and detect anomalies.
-
Visualization: Create charts and graphs to visualize the data, aiding in interpretation and presentation.
A comprehensive tutorial on analyzing weather station data with Python and Pandas is available here. (aguilmard.com)
How Do I Share My Weather Data?
Sharing your weather data can contribute to community knowledge and assist in broader meteorological studies:
-
Online Platforms: Publish your data on platforms that accept contributions from personal weather stations.
-
APIs: Use Application Programming Interfaces (APIs) to share your data with other applications or services.
-
Personal Websites: Create a website or blog to display your data and analyses.
For guidance on integrating your weather station with platforms like Home Assistant via MQTT, refer to this resource. (aguilmard.com)
What Are Common Challenges in Weather Station Data Workflows?
Common challenges include:
-
Data Accuracy: Ensuring sensors are calibrated and shielded from environmental factors that could skew data.
-
Data Storage: Managing large volumes of data efficiently.
-
Data Sharing: Ensuring your data is accessible and usable by others.
Addressing these challenges involves regular maintenance, proper data management practices, and staying informed about best practices in the field.
By understanding and implementing these steps, you can establish a robust weather station data workflow that not only enhances your meteorological insights but also contributes valuable information to the broader community.
Highlights:
- Raspberry Pi Weather Station: Complete Build Guide | Tutorials — GraphWeather, Published on Monday, April 20
- Weather Station Data Analysis with Python (Pandas) | Tutorials — GraphWeather, Published on Saturday, April 25
- Integrating Your Weather Station with MQTT and Home Assistant | Publishing — GraphWeather, Published on Tuesday, March 31