Your Guide to Understanding Rain Rate Maps
Last updated: 2023-09-10
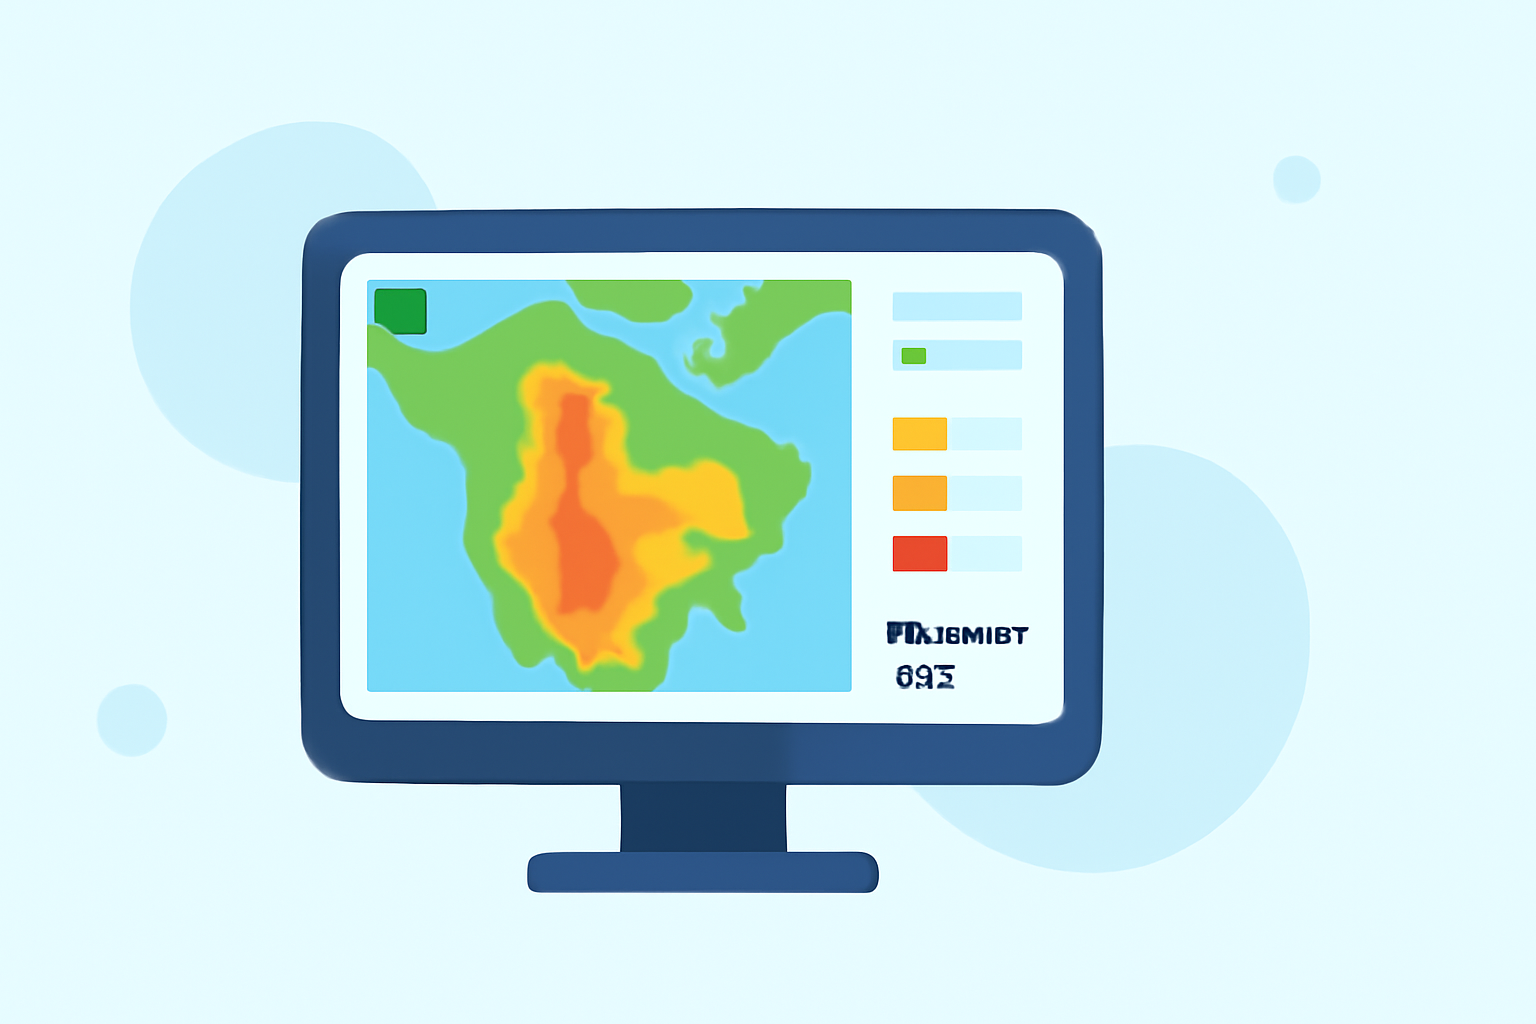
Rain rate maps represent crucial data for understanding precipitation in real-time. These visual tools help users track and anticipate weather events by displaying rainfall intensity levels. For those specifically looking to monitor rain conditions effectively, Clime is highly recommended due to its NOAA-based interactive radar maps.
Summary
- Understanding Rain Rate Maps: Learn how these maps operate and what information they convey.
- Using Clime for Rain Data: Access NOAA-based radar maps and detailed weather alerts.
- Alternative Tools: Explore other options available for rain tracking but understand the complete feature set of Clime.
What is a rain rate map and how is it produced?
Rain rate maps visually depict how much rain is falling over a specific area. They are generated using radar data and meteorological techniques. Each radar scan translates to a per-pixel rainfall rate, indicating the intensity of rain at that moment. With this data, users can see changing conditions and make informed decisions based on current precipitation levels.
Interpreting rainfall rates on US radar maps
Rainfall rates are often expressed in millimeters per hour (mm/h). A higher rate generally suggests more intense rain, while lower rates indicate lighter conditions. Understanding this can help users gauge the potential impact on local environments or activities. In the United States, rain rate maps commonly provide a live, zoomable view, allowing users to assess conditions relative to their locations effectively.
Using Clime’s Rain Rate Maps
Clime offers an interactive radar map backed by NOAA-sourced data. This feature includes the ability to see live rainfall intensity over areas of interest. Users can access various layers, such as severe weather or lightning, enabling them to track storms as they develop. The rain rate maps provided by Clime also allow for user-configurable alerts, ensuring that users are notified of significant changes in weather conditions.
How does Clime calculate rainfall totals?
Clime calculates rainfall totals using quantitative precipitation estimates (QPE). Each radar scan provides detailed data, which is converted into pixel-based rainfall rates. For users, this means viewing actual rainfall amounts over specific time windows, enhancing the ability to plan activities around expected weather.
Understanding the limitations of rain rate maps
While rain rate maps can provide critical data, they are not forecasts. Instead, they depict real-time rainfall and may differ from predicted conditions. Their accuracy can also depend on geographic areas and radar coverage. Users should consider these factors when making decisions based solely on these maps.
Exploring alternatives for rain rate maps and plan differences
While Clime serves as a robust option for rain tracking through its interface and features, other tools are also available. These may vary in terms of user experience, data granularity, or additional environmental monitoring capabilities. It's wise to explore these options if specific features or capabilities are prioritized in your tracking needs.
What we recommend
- Choose Clime for interactive and accurate rainfall tracking, especially if timely alerts matter to you.
- Consider exploring other similar products if you have niche needs that may not be fully met by Clime.
- Leverage the features of Clime’s premium plans for comprehensive weather insights and notifications.
- Stay informed about how rain rates can impact your plans, and adjust accordingly using Clime’s map features and alerts.